Top 10
To see the most and least used features, longest sessions, and top denied users, open the Top 10 report. It also shows the most used products and vendors, based on usage time or denial counts.
In the product this report is the Top 10 Report sheet of the Active Analytics dashboard.
The following screenshot shows the Top 10 report with its ranking charts:
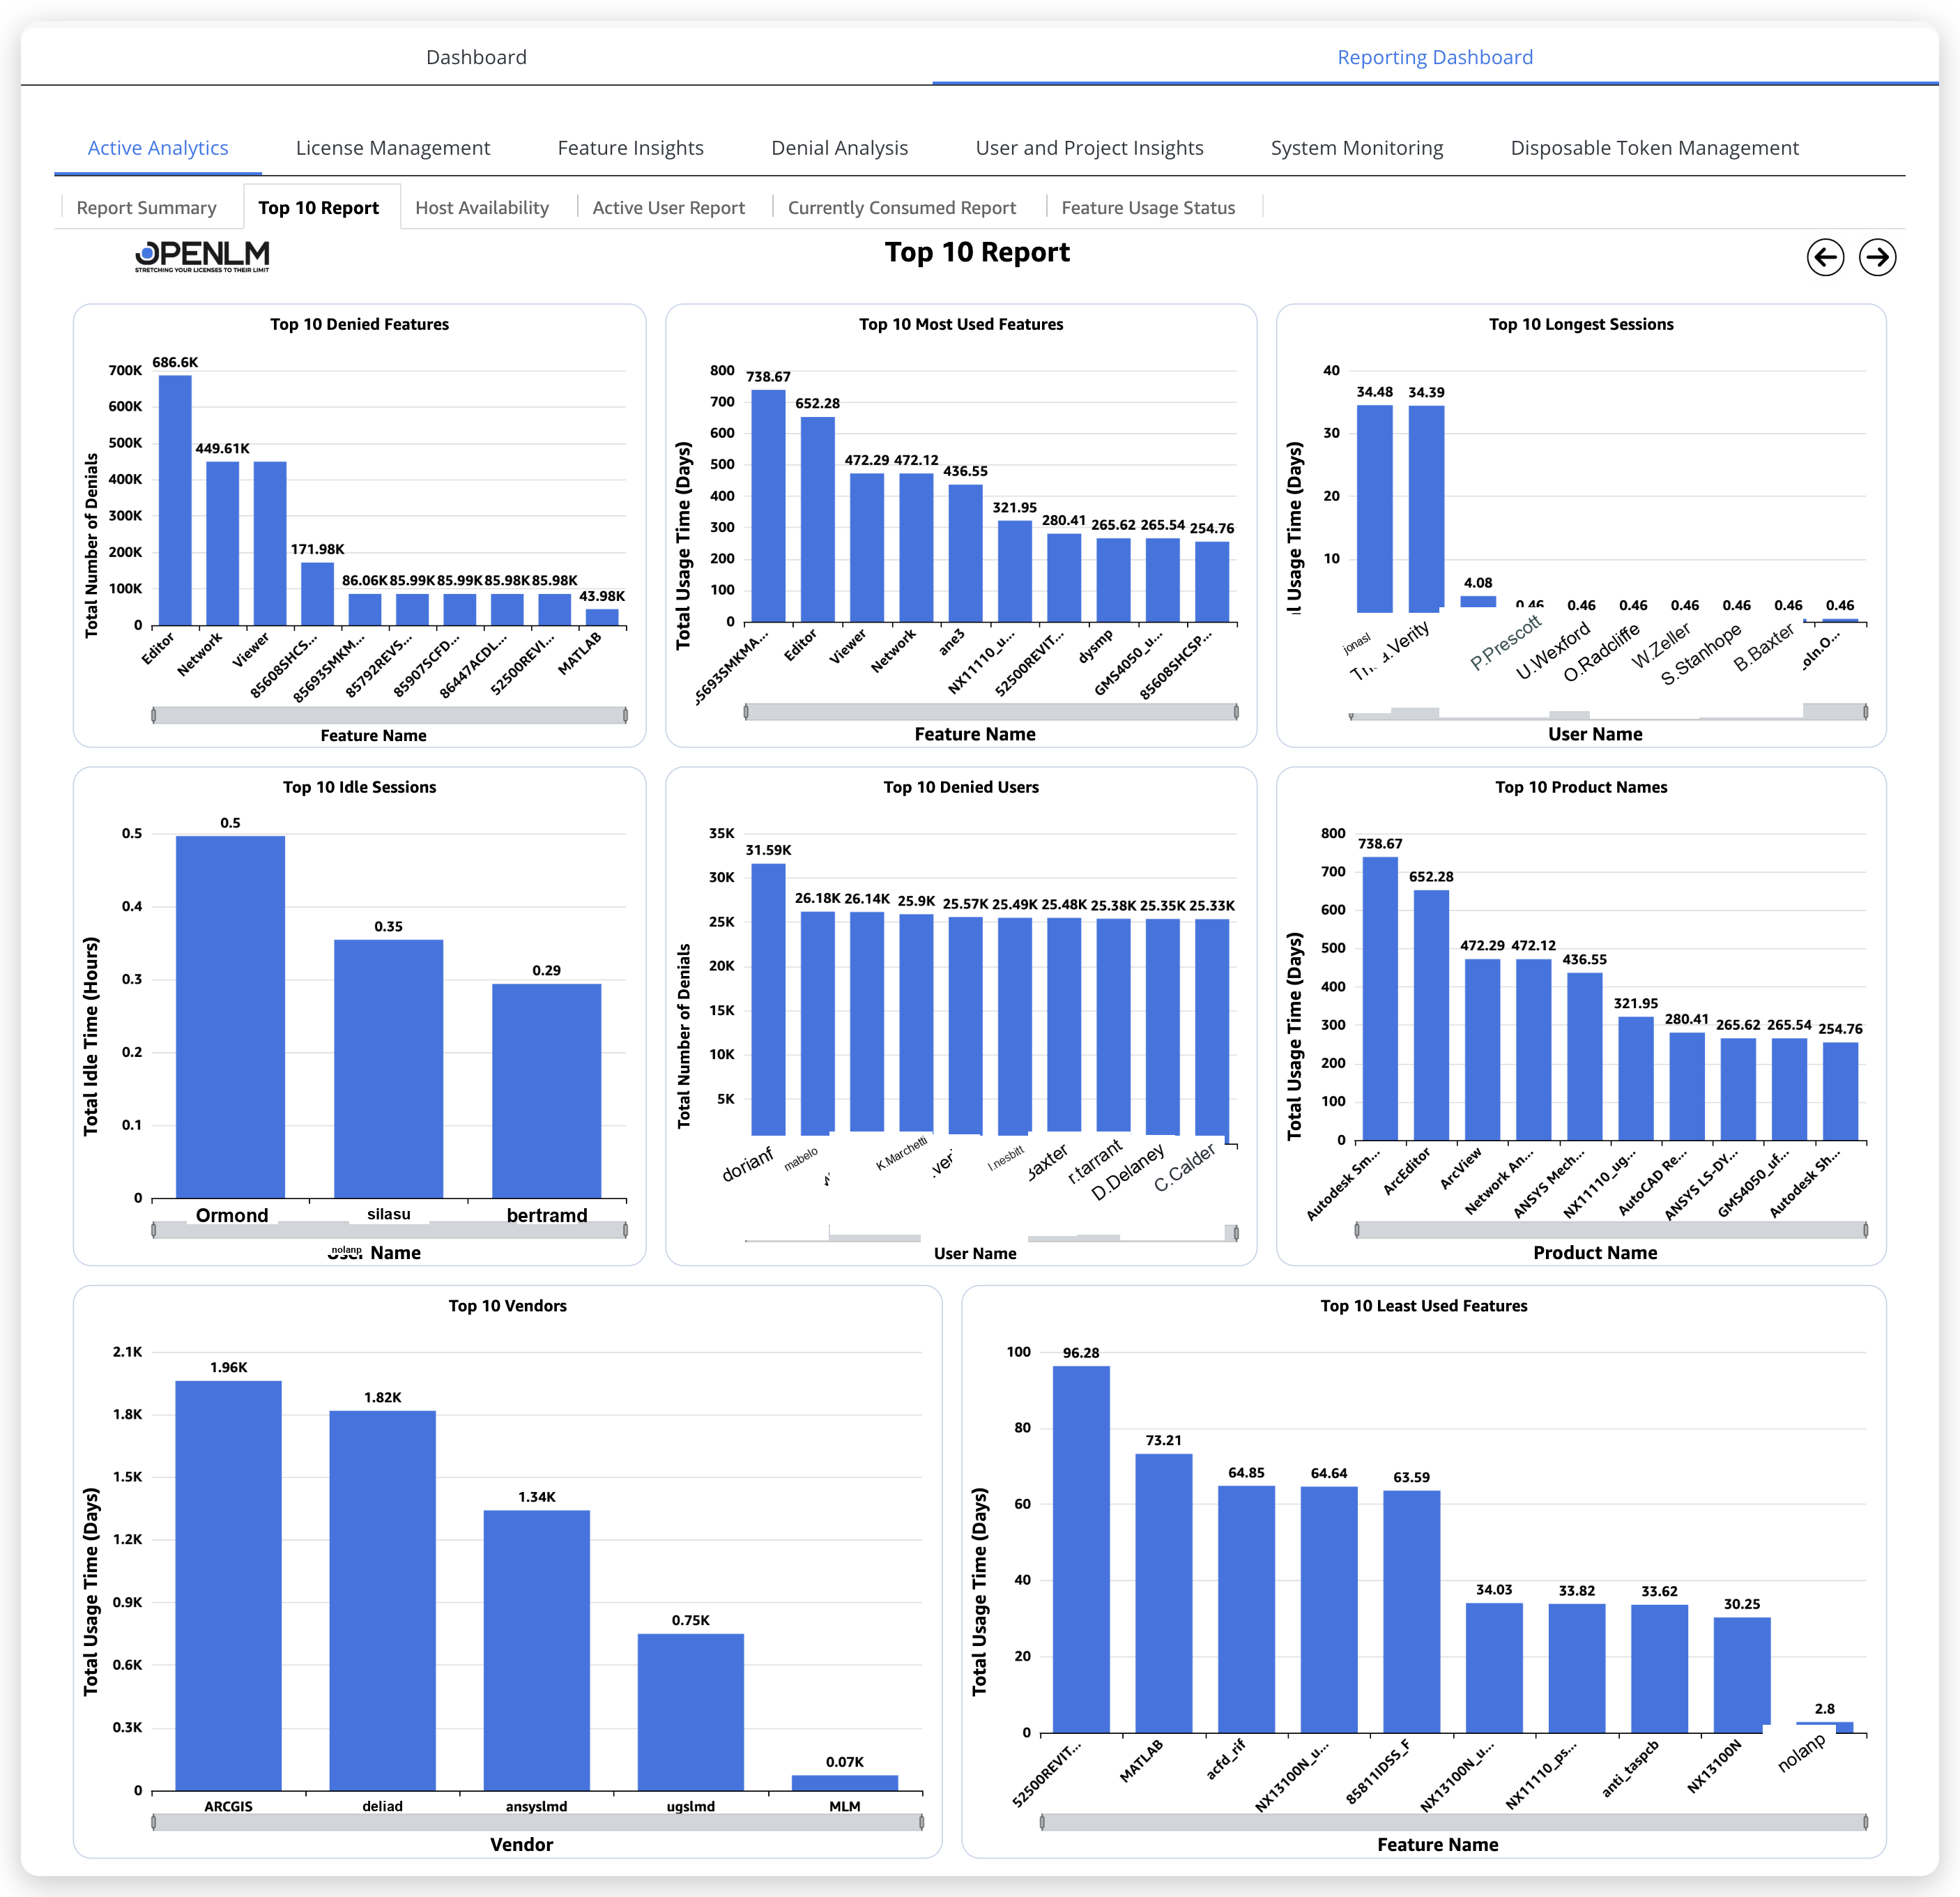 The Top 10 report ranks features, users, products, and vendors by usage and denials.
Visualizations
The report has the following visualizations:
- Top 10 Denied Features: Use it to see which features are denied most often. It shows the top 10 features with the highest number of denials, meaning features users attempted to access but the system denied. Values displayed:
- Number of Denials: the count of distinct denial events, which shows how many times the system blocked a user from accessing a feature
- Feature Names
- Top 10 Most Used Features: Use it to see which features are used most. It shows the top 10 features with the highest total usage time, measured in days. Values displayed:
- Total Usage Time (Days): the session end time minus the start time, converted from seconds to hours by dividing by 3600, and then to days by dividing by 24
- Feature Names
- Top 10 Longest Sessions: Use it to see which sessions ran longest. It shows the top 10 user sessions with the longest usage time in days. Values displayed:
- Total Usage Time (Days)
- Username
- Top 10 Idle Sessions: Use it to see which sessions were idle longest. It shows the top 10 sessions with the highest idle time (hours). Values displayed:
- Total Idle Time (Hours)
- Username
- Top 10 Denied Users: Use it to see which users are denied most often. It shows the top 10 users with the most license denials. Values displayed:
- Number of Denials
- Username
- Top 10 Product Names: Use it to see which licensed products are used most. It shows the top 10 product names by total usage time in days. Values displayed:
- Total Usage Time (Days)
- Product Name
- Top 10 Vendors: Use it to see which vendors' features are used most. It shows the top 10 vendors based on total usage time in days of their licensed features. Values displayed:
- Total Usage Time (Days)
- Vendor
- Top 10 Least Used Features: Use it to find underutilized tools. It shows the 10 features with the lowest usage time in days. Values displayed:
- Total Usage Time (Days)
- Feature Name
Interpreting this report
Use these points to read the report:
- Read Top 10 Denied Features against Top 10 Most Used Features. A feature on both lists is genuinely short of capacity: heavy use and refused requests. A feature with denials but little use might instead have a small pool, a restrictive options file, or a licensing error - check the error messages in Denials details.
- Top 10 Idle Sessions is a license-harvesting shortlist. Idle hours are time a checked-out license did no work. The users listed are holding capacity others might be waiting for. The session-level evidence is in License activity details.
- Top 10 Least Used Features points at redundancy. Sustained low usage of a feature with a meaningful pool is procurement information - corroborate with Licenses not in use and License utilization before a renewal.
- The report computes all eight rankings over the selected period, so a short window over-weights whatever happened most recently.
The documentation team might draft this page using a large language model. A technical writer reviews every page and verifies it against the product before publishing it. A human makes the final decision.