OpenLM Easy Admin User Interface modules and reports
The following article shows screenshots of the EasyAdmin User Interface modules and reports with some brief descriptive information about their function.
EasyAdmin user interface
The EasyAdmin user interface is the main OpenLM user interface for reporting and system configuration. It is accessible from any standard internet browser, for example, Mozilla Firefox, Microsoft Edge, Apple Safari & Google Chrome.
EasyAdmin user interface dashboard
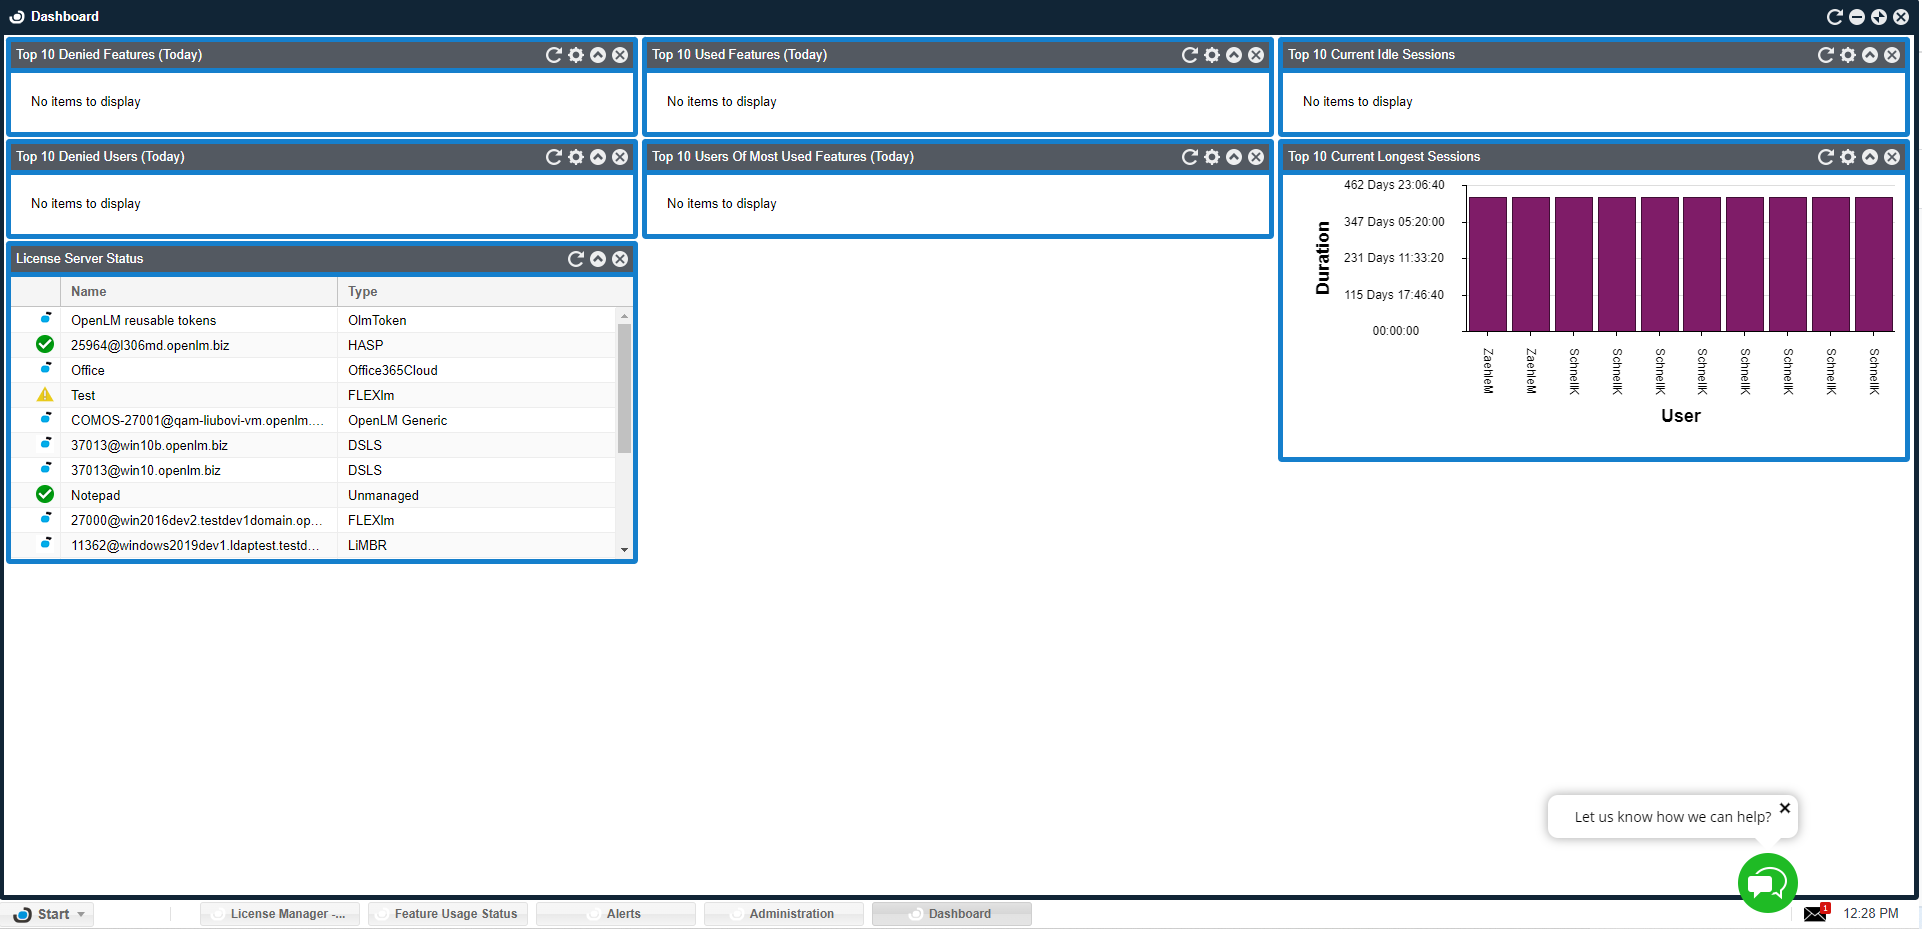
The Dashboard allows users to get system status information in a single glance:
- License server status.
- OpenLM Broker status on each license server.
- General statistics on licenses on daily and weekly license usage.
- One-glance status of critical features over multiple license servers.
- Alerts system messages.
The Dashboard features a Windows-like interface that facilitates access and management of Windows on a standard browser interface.
Widget windows
License servers
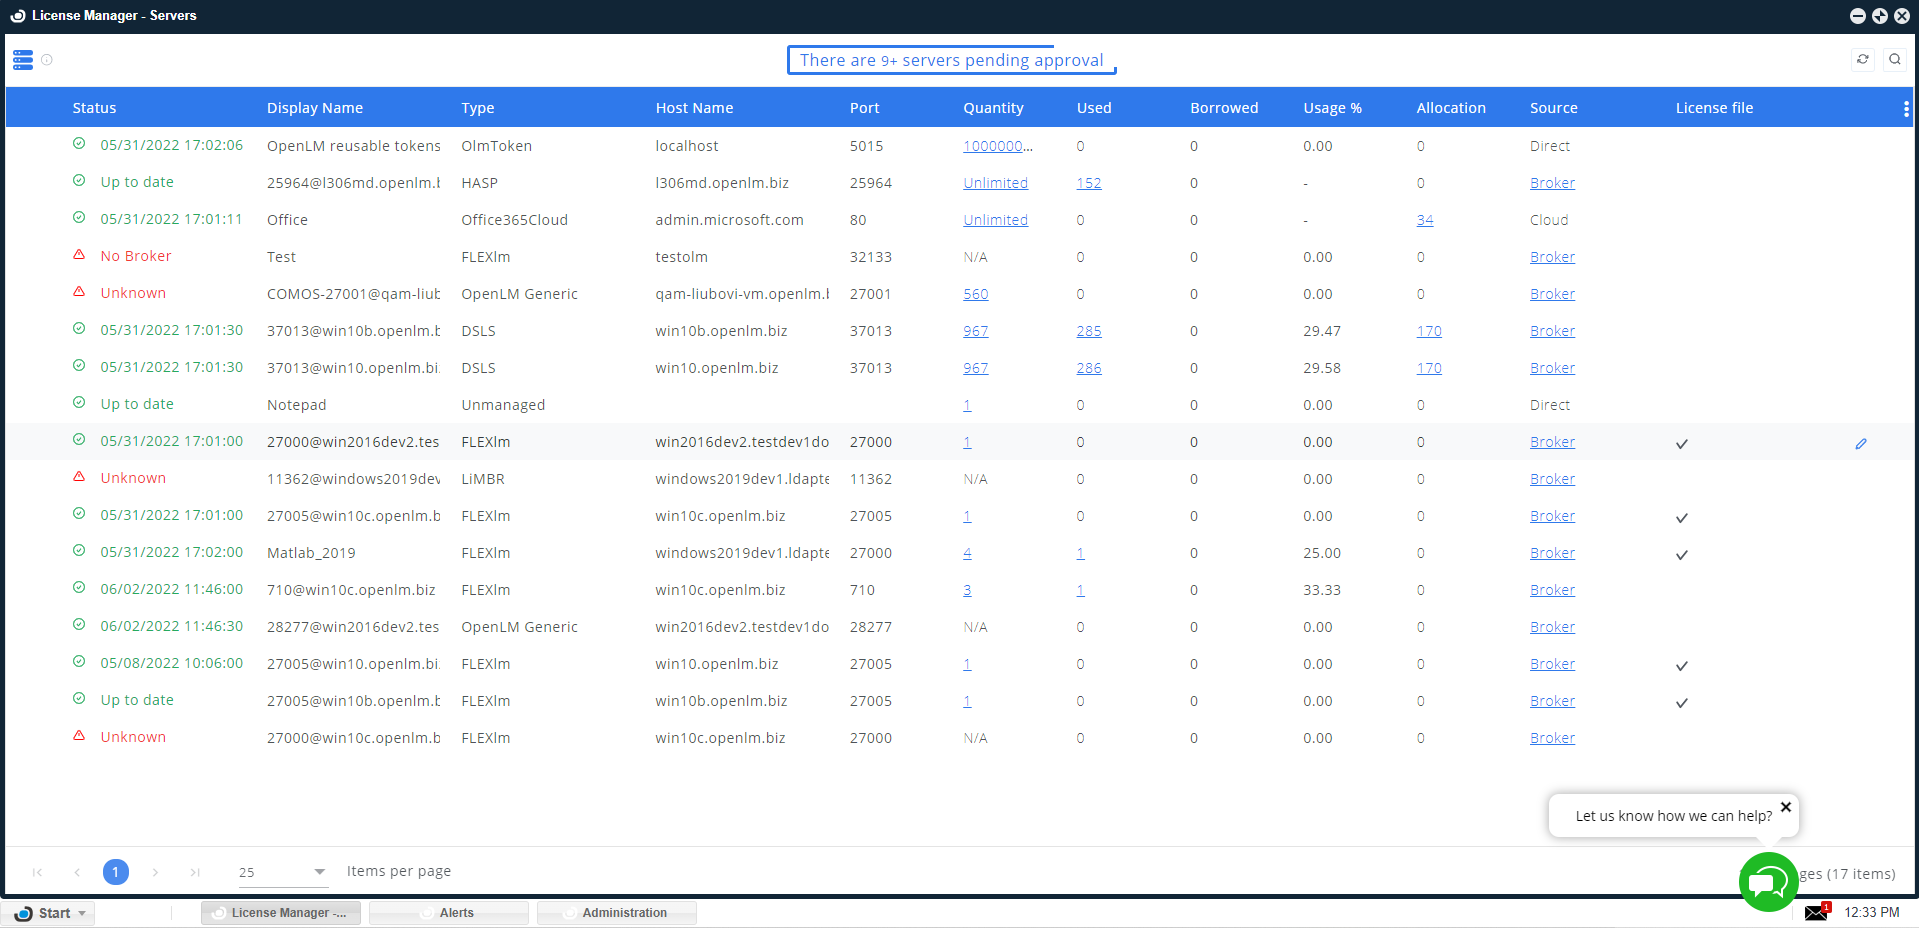
The License servers' window is typically the first place to start. It presents the status of monitored license servers and the status of the OpenLM Brokers installed on the license server machines. This includes:
License Server status:
- Green: Up
- Yellow: Problem on the license server side, for example, Broker down, LM down, Time difference error.
- Red: Down. No communication with the license server.
Total number of licenses, with a hyperlink to the respective license inventory table
Used licenses, with a hyperlink to respective Currently Consumed Licenses table
Borrowed licenses
Usage percentage
Broker information and actions:
- Import files from the license server machine (for example, License file, Options file)
- Upload license files to the license server machine, and invoke a subsequent reread or restart action
- Broker version, and related Java (JRE) version
- License Server time
Host availability
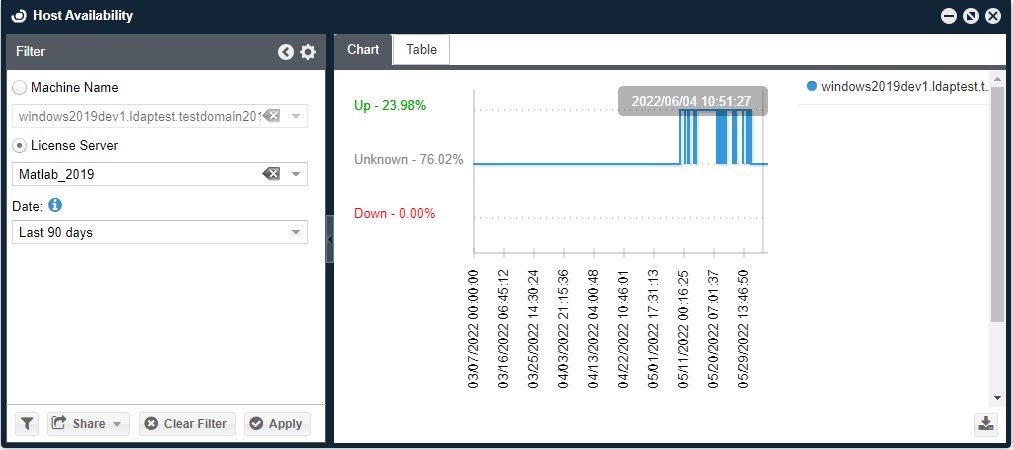
The host availability indication diagram provides the full information regarding the server's activity over time.
General statistics
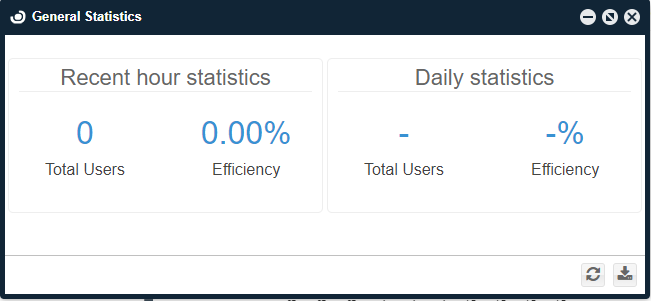
This window shows a general statistical overview of user activity and license utilization efficiency as recorded in the system.
Alerts
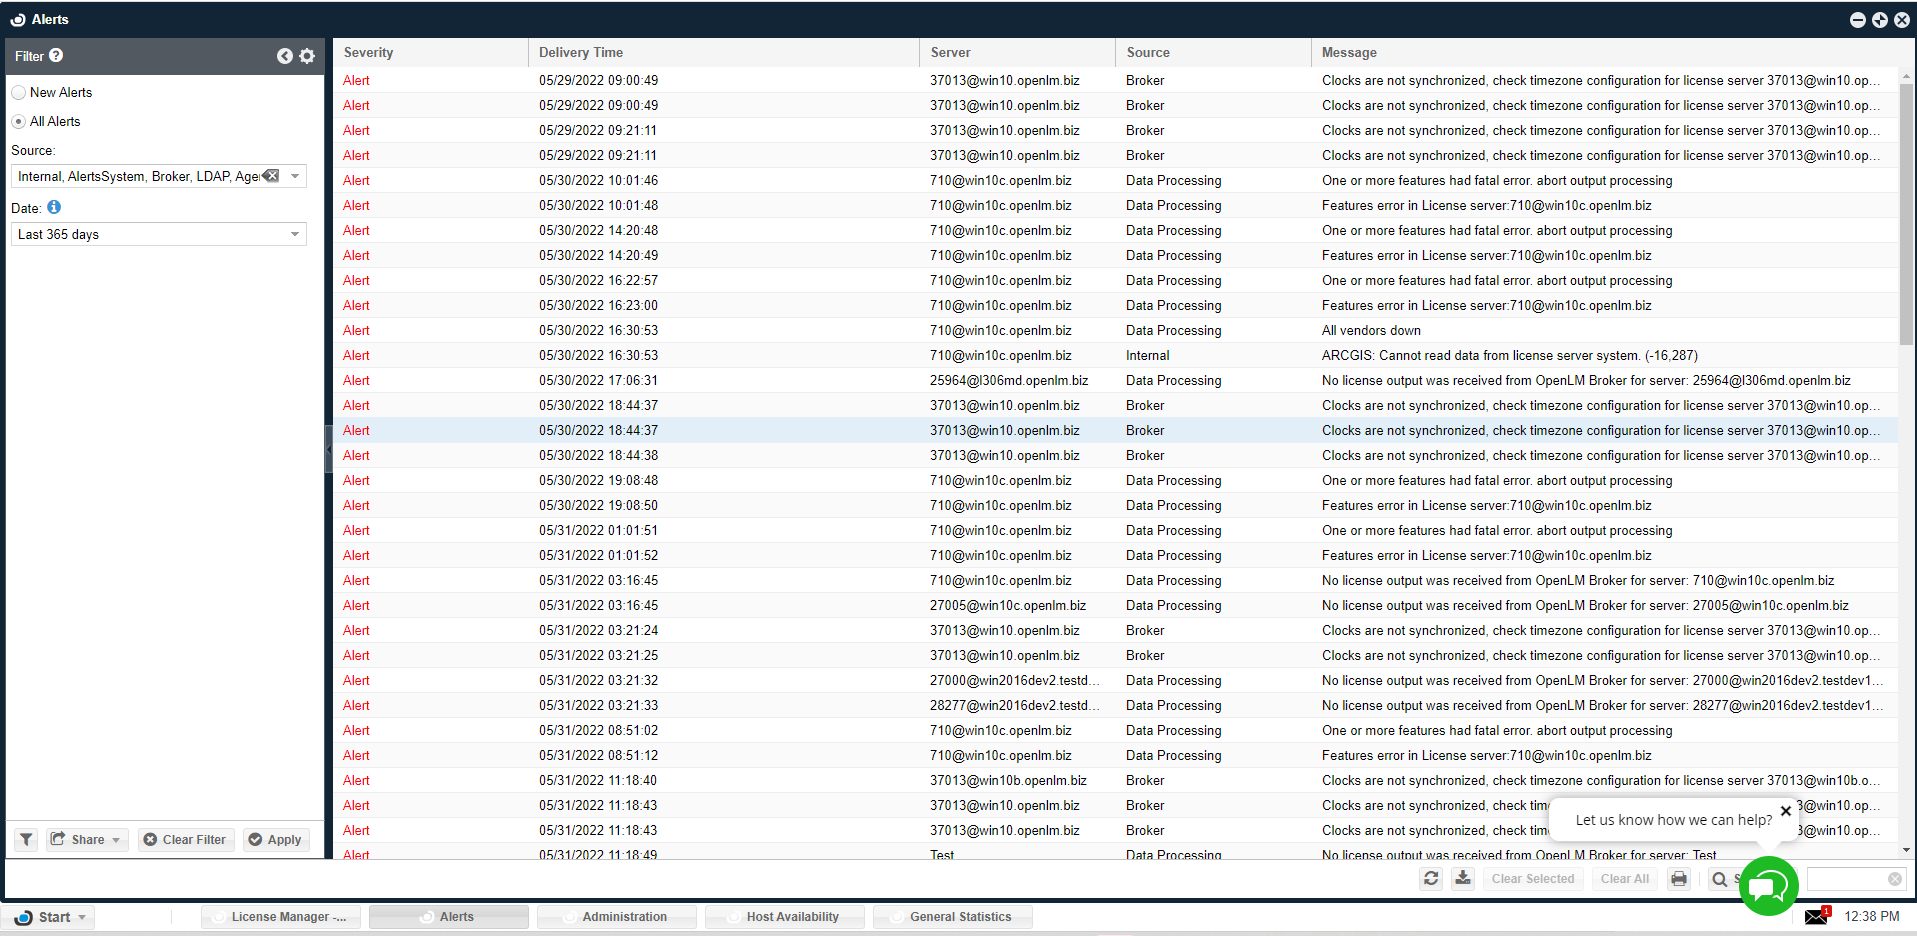
The OpenLM Alerts module is designed to ensure the stability of the licensing system. It allows system managers to define alert conditions and consequent actions that will be taken when these conditions are met. The system can present alert messages on the EasyAdmin 'Alerts' window, as well as a log file. It can also be set to send alert messages to predefined email or SMS accounts.
Recent features denials
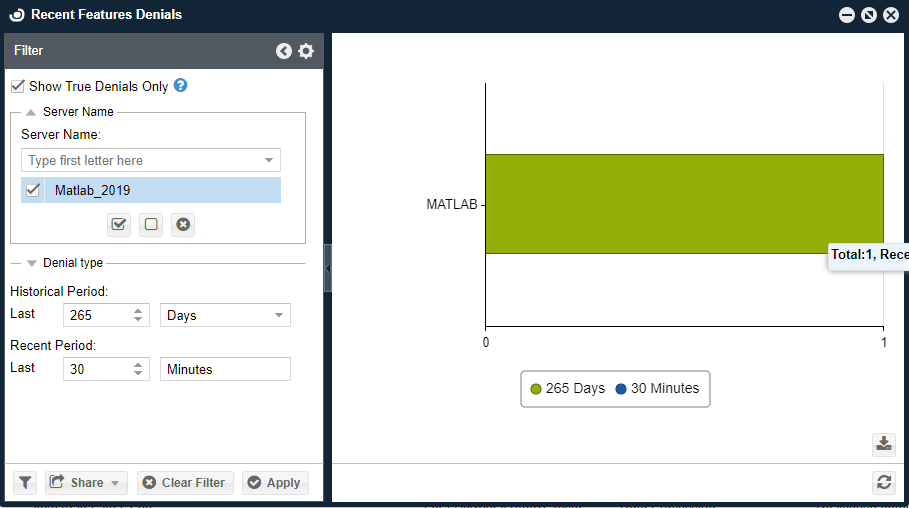
This window provides preliminary statistic processing of license denials per feature: It presents the number of denied license requests in long term and short term period.
Feature usage status
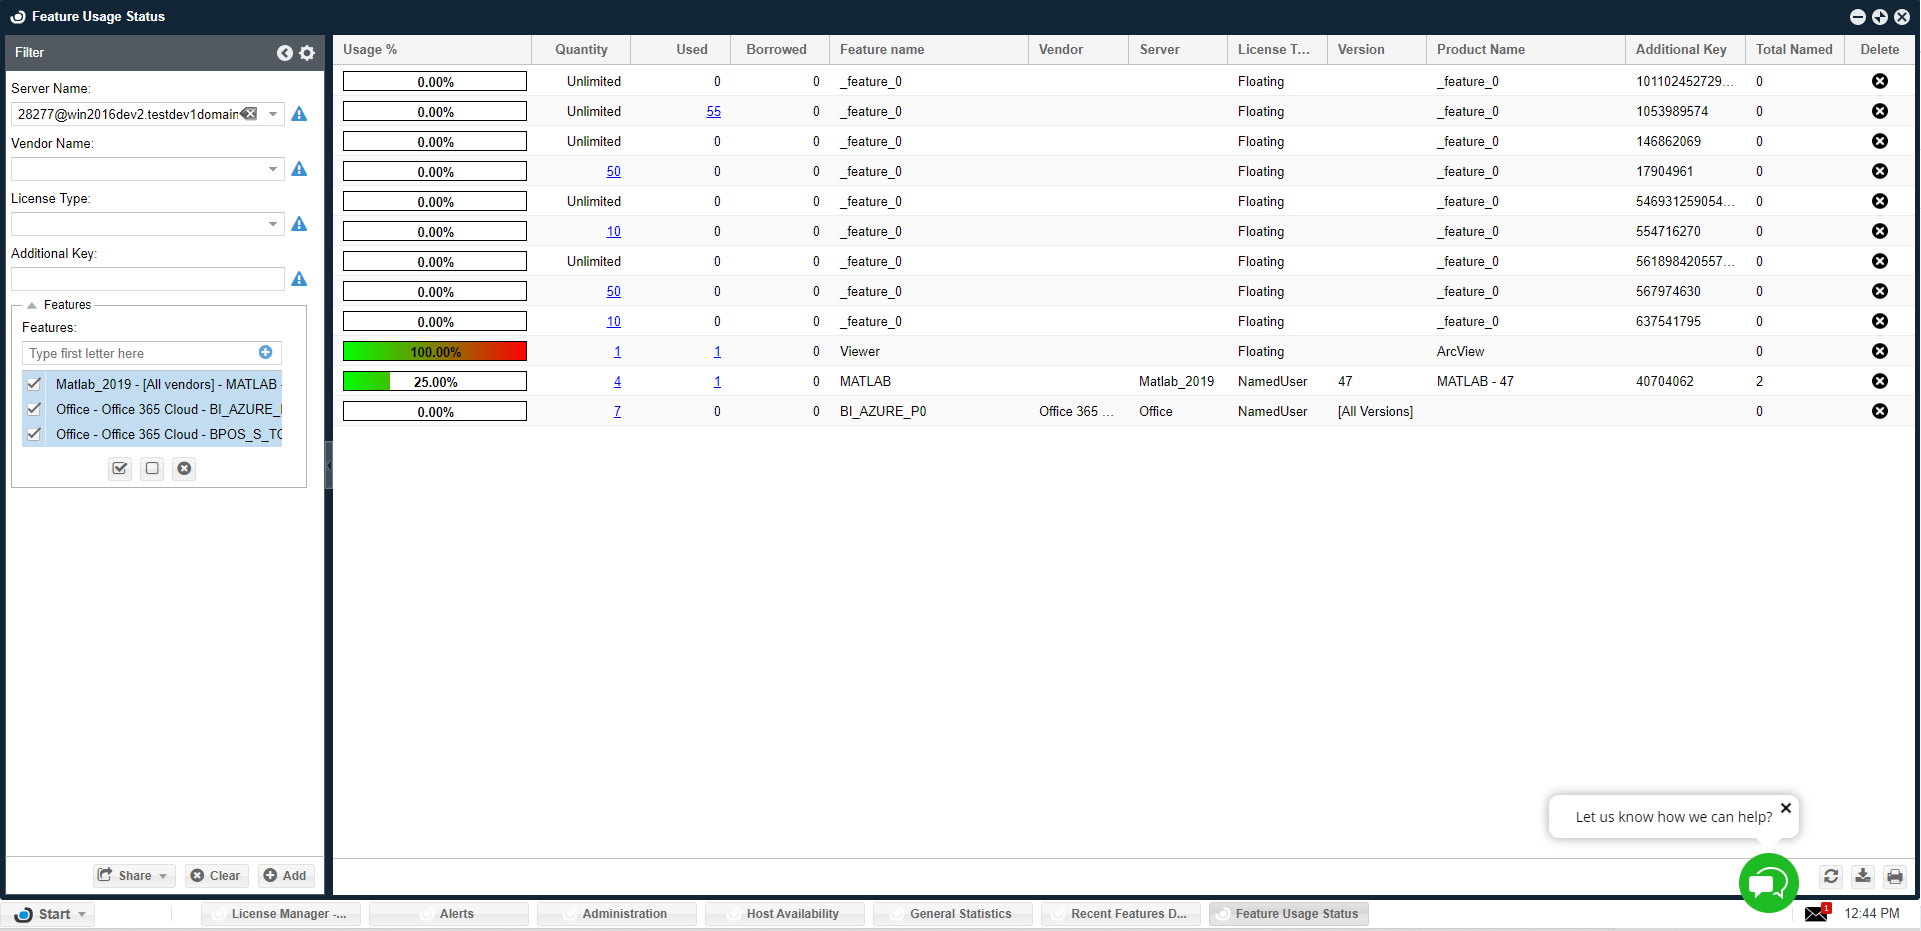
This window shows the number of licenses used, the number of licenses borrowed, and the license-usage percentage. It's easy to add features by using the filter.
Operational
Currently consumed licenses
Just as the name suggests, the Currently Consumed Licenses window presents, in real time, the licenses that are being checked out from the license pool.
It is important to note that many license management tools do not provide such real time information.
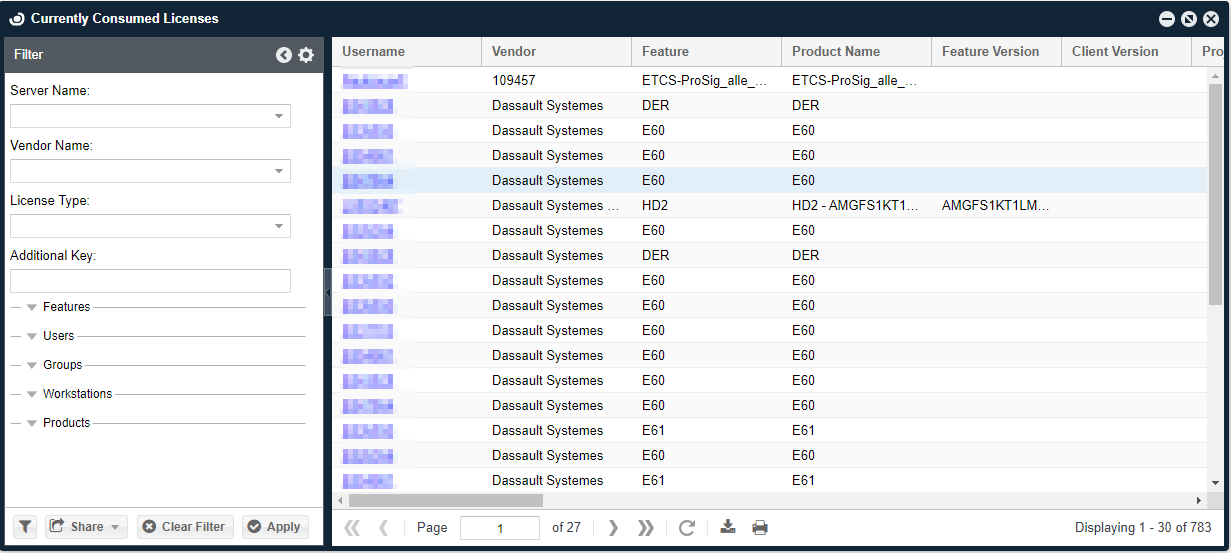
In addition to this, the Currently Consumed Licenses window presents a few more interesting capabilities;
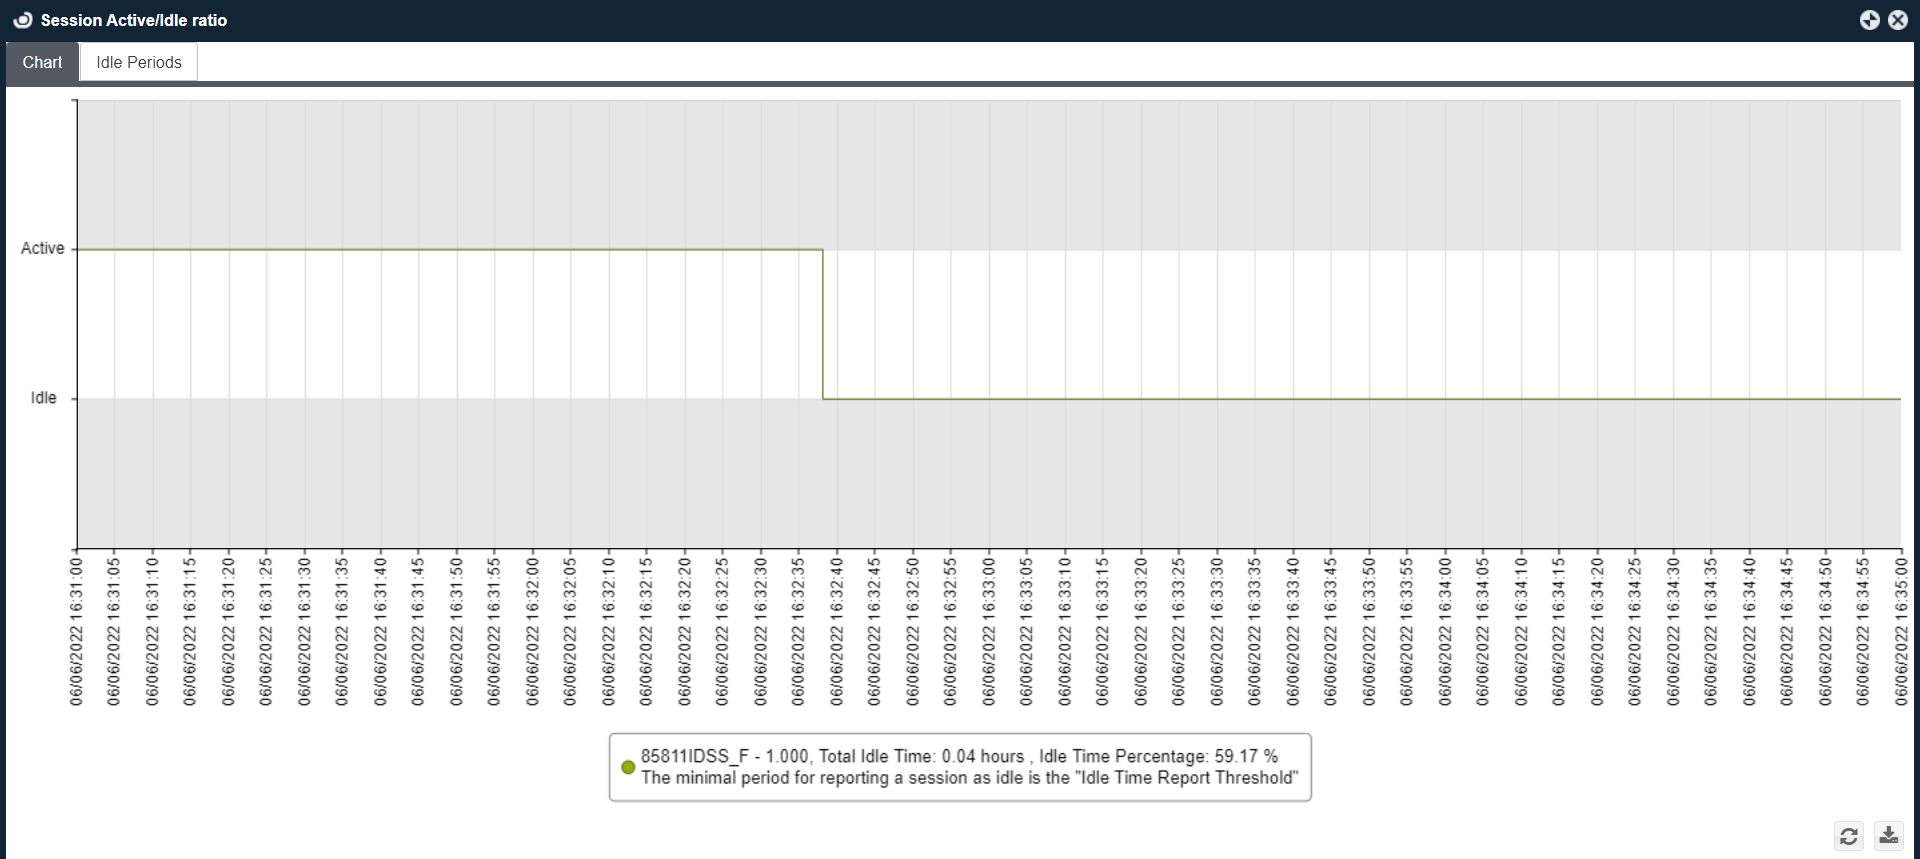
- License managers may label licenses as occupied, when in fact they are idle and wasting your limited resources.
Select on the crescent  icon to present the active versus idle periods within running sessions
- The Currently Consumed Licenses window also serves as an interface for authorized system managers to retrieve a license from any user when necessary.
For more information on these important capabilities, refer to this document.
Released licenses
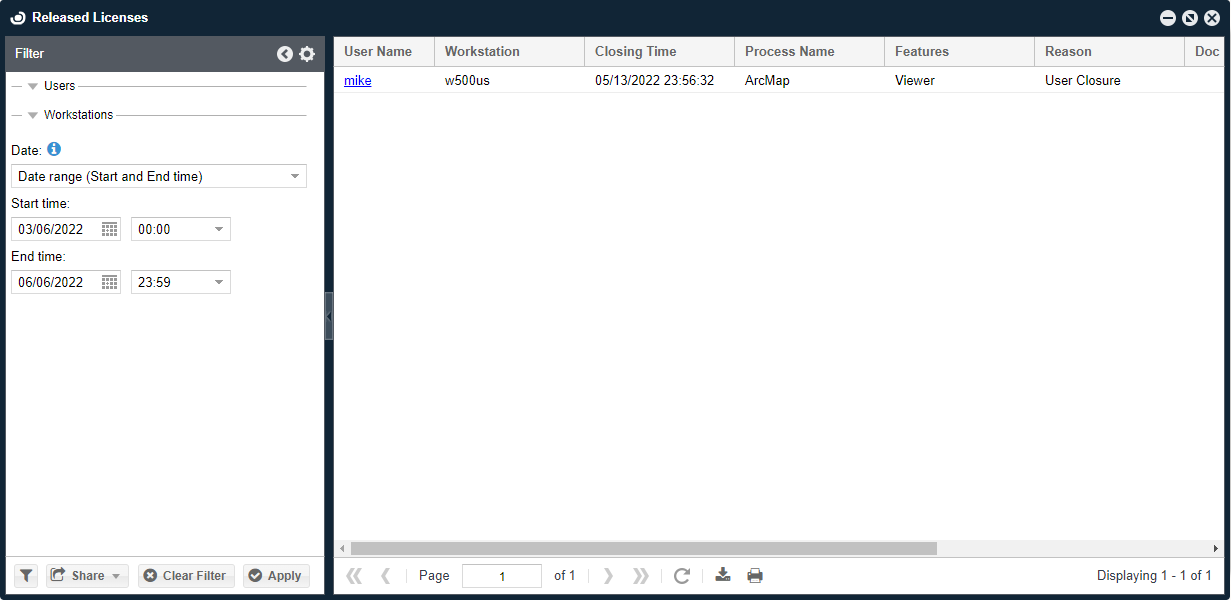
The Released Licenses window reports license release (check-ins). This functionality is only relevant for applications with supported extensions such as ESRI Desktop ArcGIS and Autodesk or those who have set rules with OpenLM's Application Manager extension.
Management
Licenses
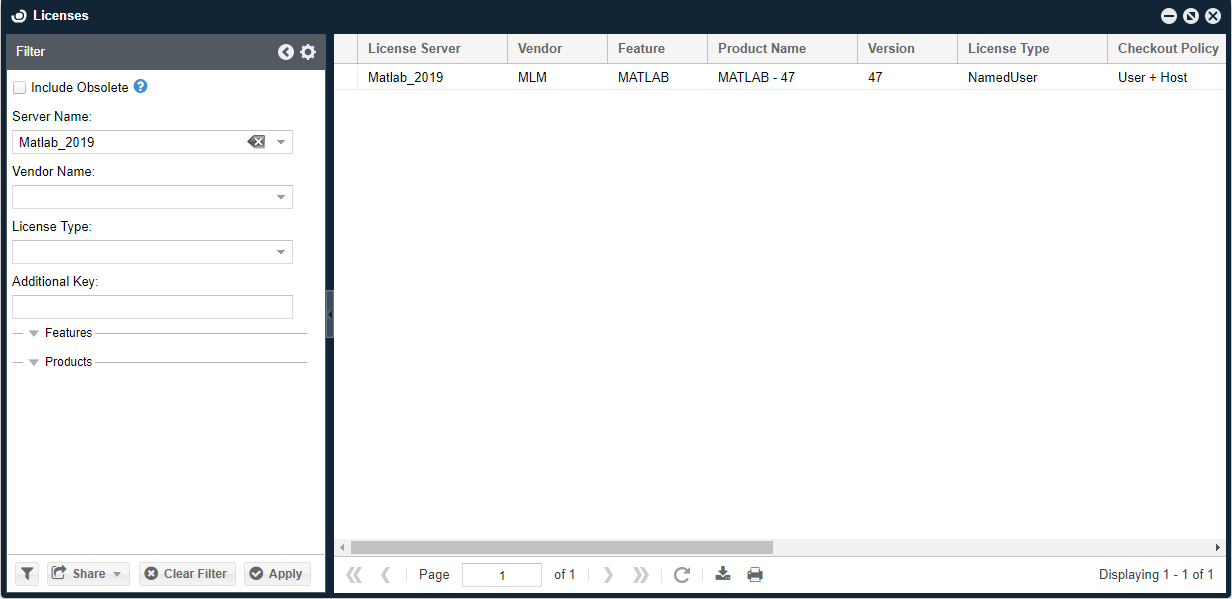
The licenses window lists available licenses and allows easy management of the organizational assets. A sophisticated sliding filter allows users to filter long lists easily.
OpenLM EasyAdmin User Interface supports advanced features like FlexNet packages (As used by Autodesk the makers of AutoCAD). License Packages appear as boxed items.
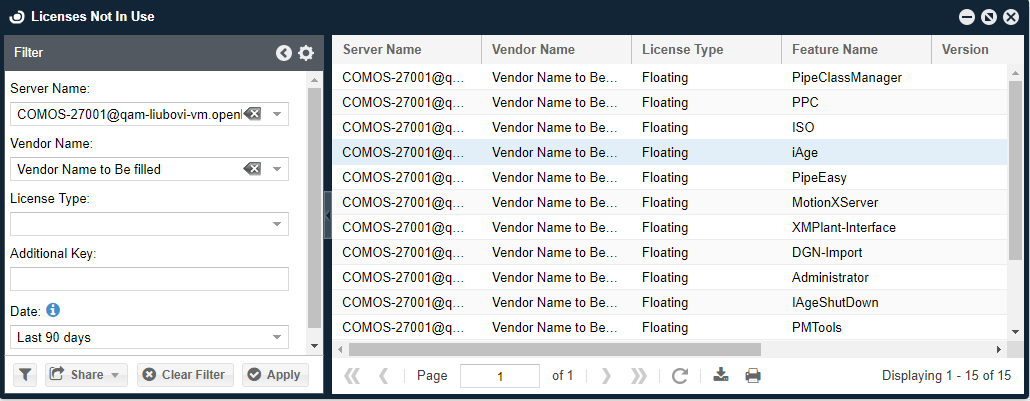
Licenses not in use
Single out licenses that have not been used for a predefined period of time.
License utilization
This chart indicates the license usage efficiency. Each column 'x' answers the question: "what is the percentage of usage time that at least x licenses have been in use?". This form of presentation ignores momentary usage peaks and provides a vivid representation of the true license consumption pattern. It clearly depicts the number of licenses that are actually required by the organization.
The Quality of Service line indicates the number of required licenses to support a certain percentage of license requests. In the following example, the chart shows that only 7 licenses (out of 12 available licenses) are required to support 96% of license requests:
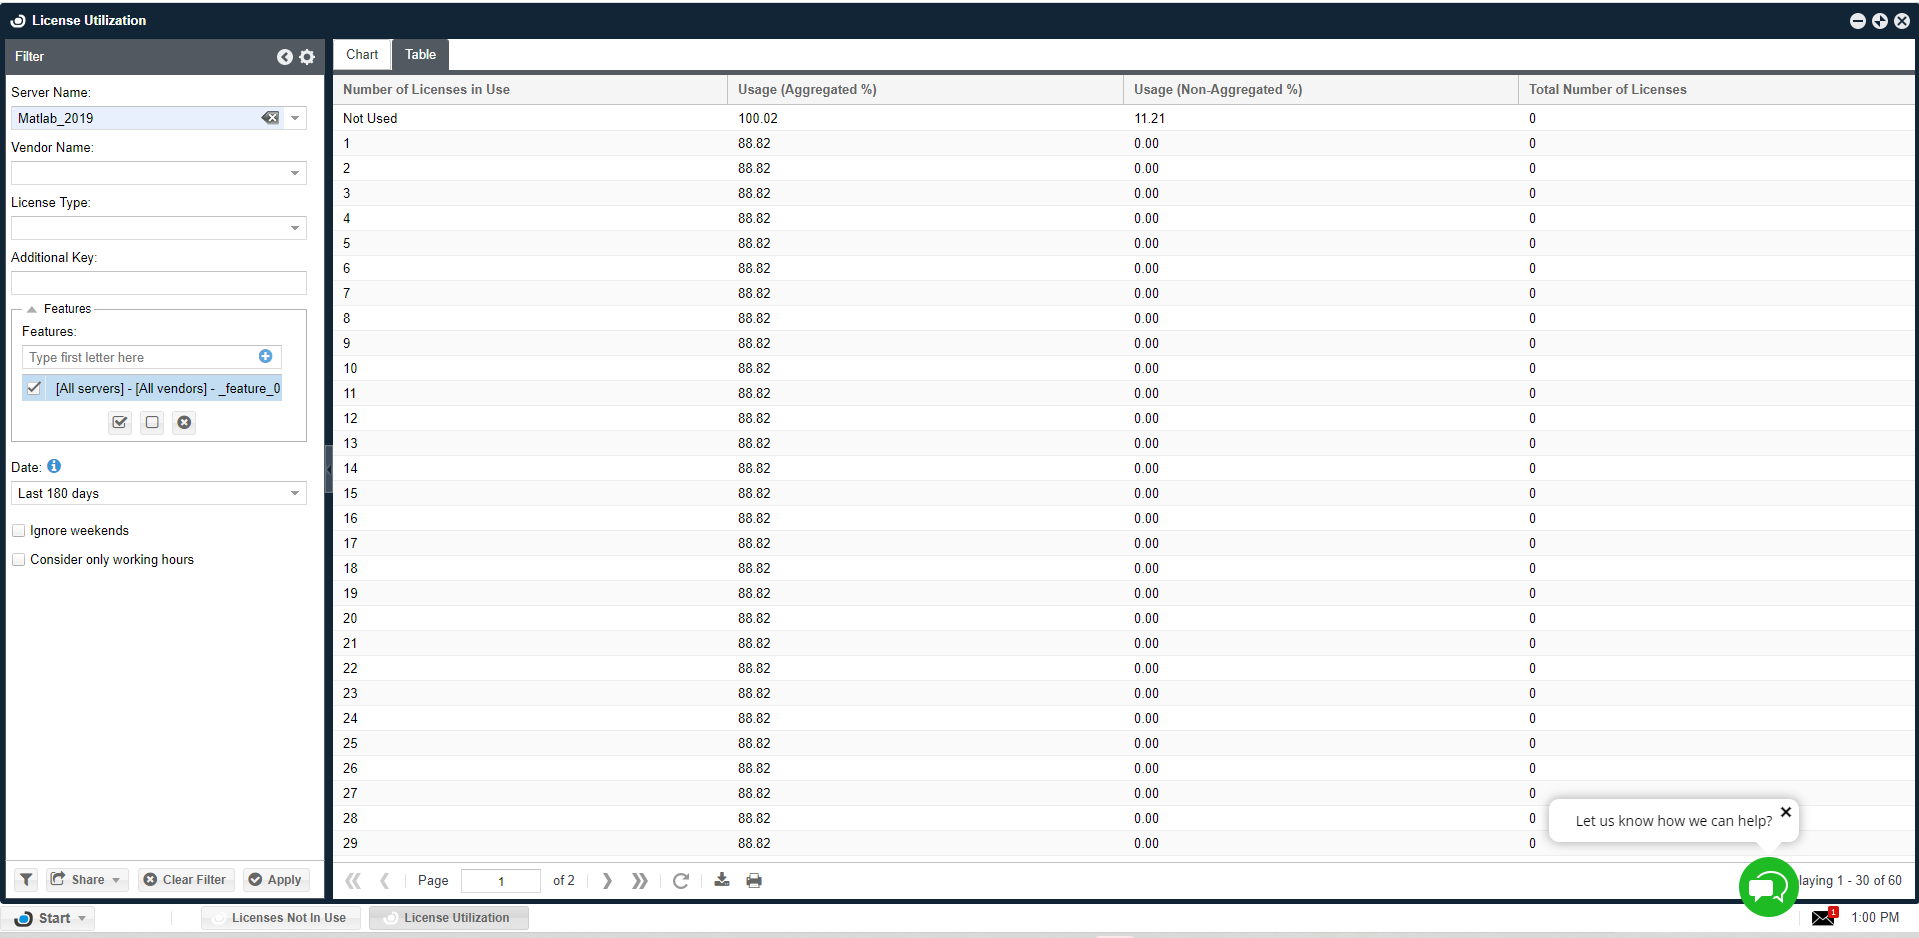
For more information about this important report window, refer to this document.
License procurement
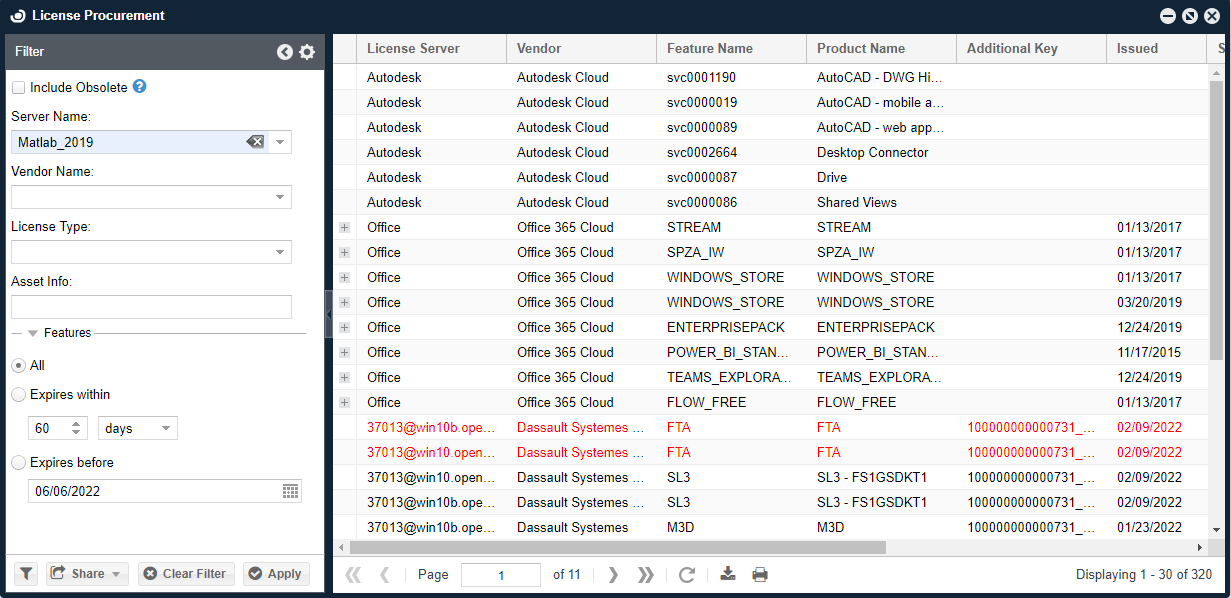
This window lists all the available license information resident in the OpenLM database.
It facilitates taking inventory of the organizational software assets. The information presented in this window includes:
- License package contents
- Feature properties, for example, Feature name, Product name, Vendor
- License properties, for example, Quantity, Start, Issue and Expiration dates. Licenses that are approaching their expiration date are marked with red.
- FlexLM License file information, for example, Vendor info, Asset Info, Vendor String
Audit report
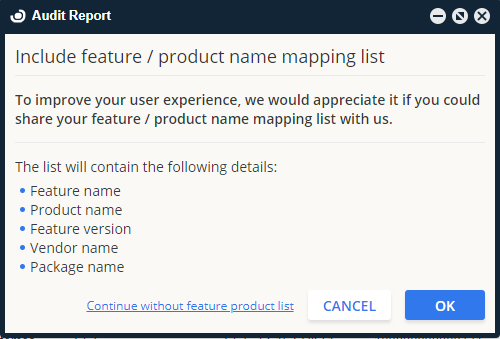
The audit Report is a PDF document that contains the OpenLM deployment status in the environment. These details include a list of all the vendor daemons, license services, components of OpenLM installed, and the number of unique users monitored by the OpenLM system in the past 3 months. Customers can select to share the feature/product name mapping list in the audit report.
An audit report is required during maintenance renewal to compile a new license file.
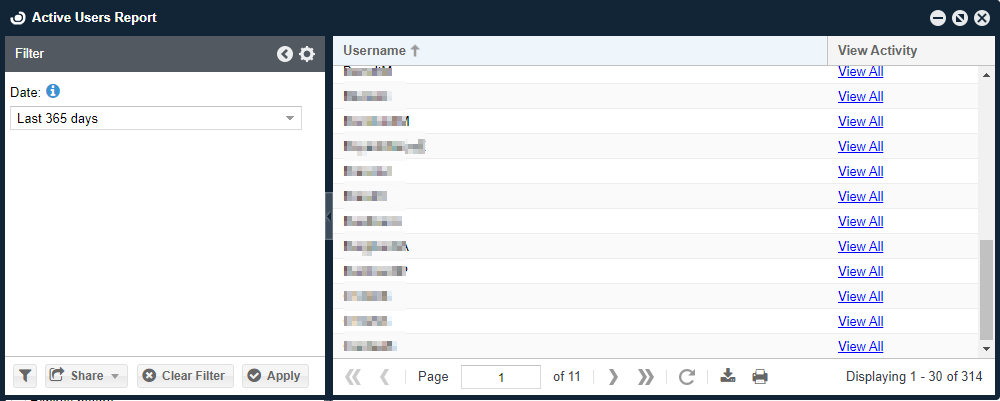
Active users report
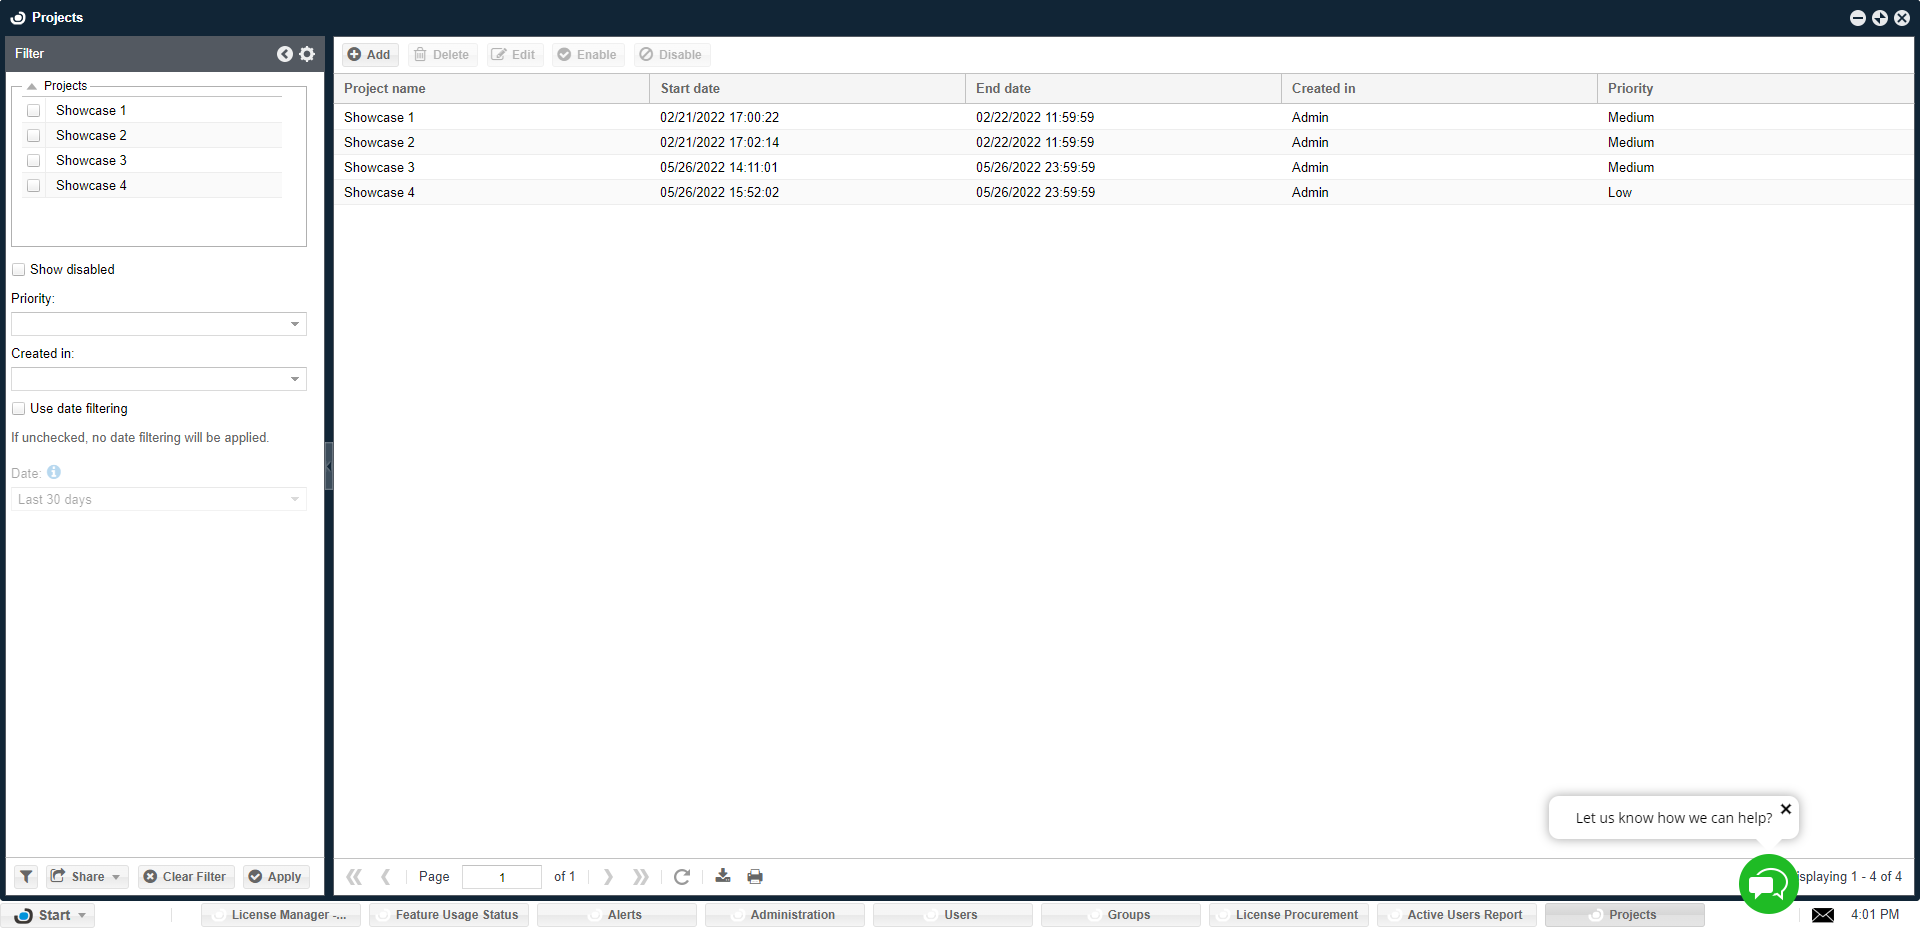
Projects
Reports
Project usage
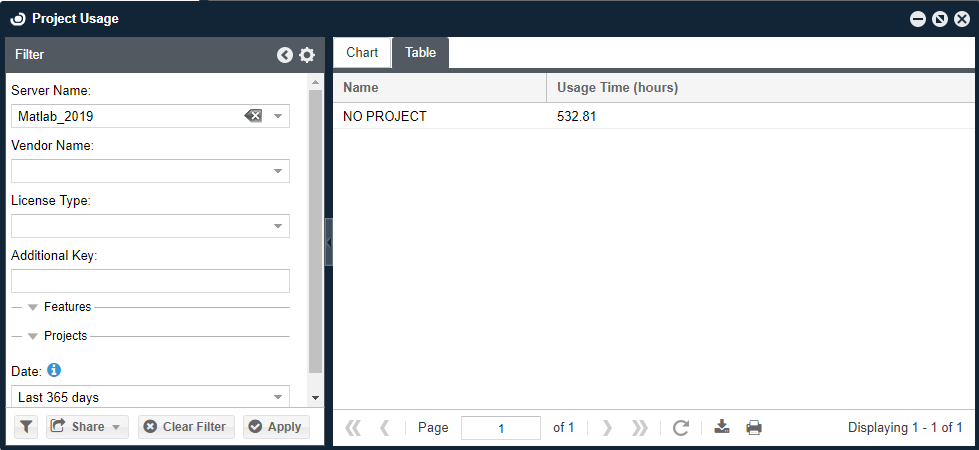
OpenLM allows organizations to manage users according to groups and projects and easily obtain the total usage time for these groups.
This could be done either manually or by synchronizing the OpenLM database with the organization's Active Directory. This functionality is often applied to implement a license charge-back policy (license usage billing).
Project reporting allows project-oriented companies to get license usage time according to the active project, as reported by the end user.
Group usage
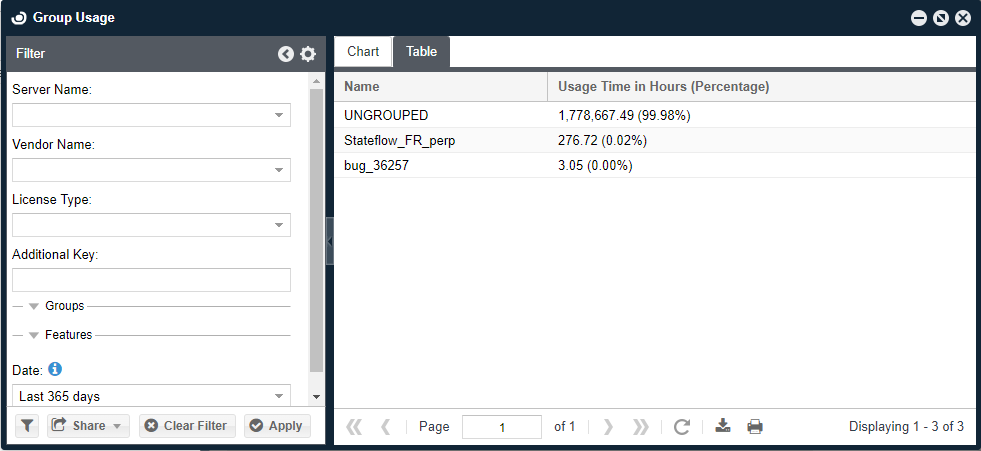
Group reporting allows managers and system administrators to obtain license usage statistics according to groups.
License usage
The license usage reports allow system administrators to compare the actual license usage to the number of available licenses.
The smart filter allows users to build a customized list of licenses and view their total usage.
According to the tabs in the display pane, this report is available in 3 different formats: as a table, chart, or heatmap diagram, as depicted below.
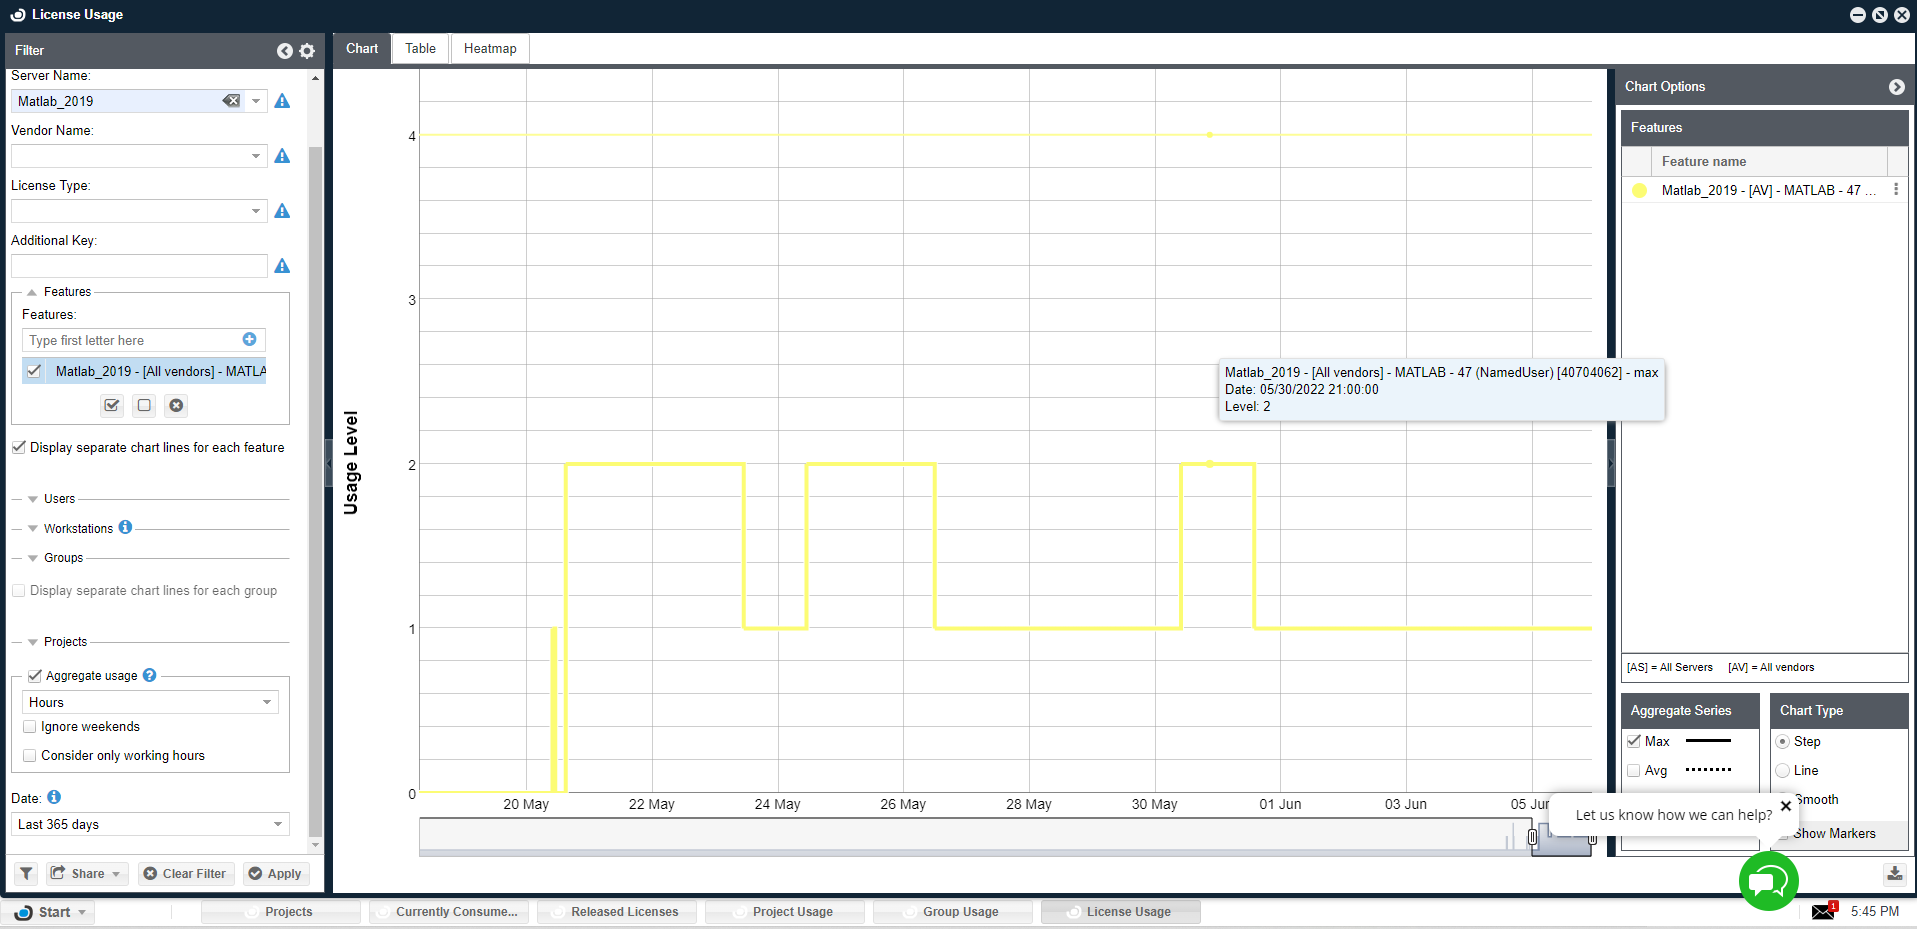
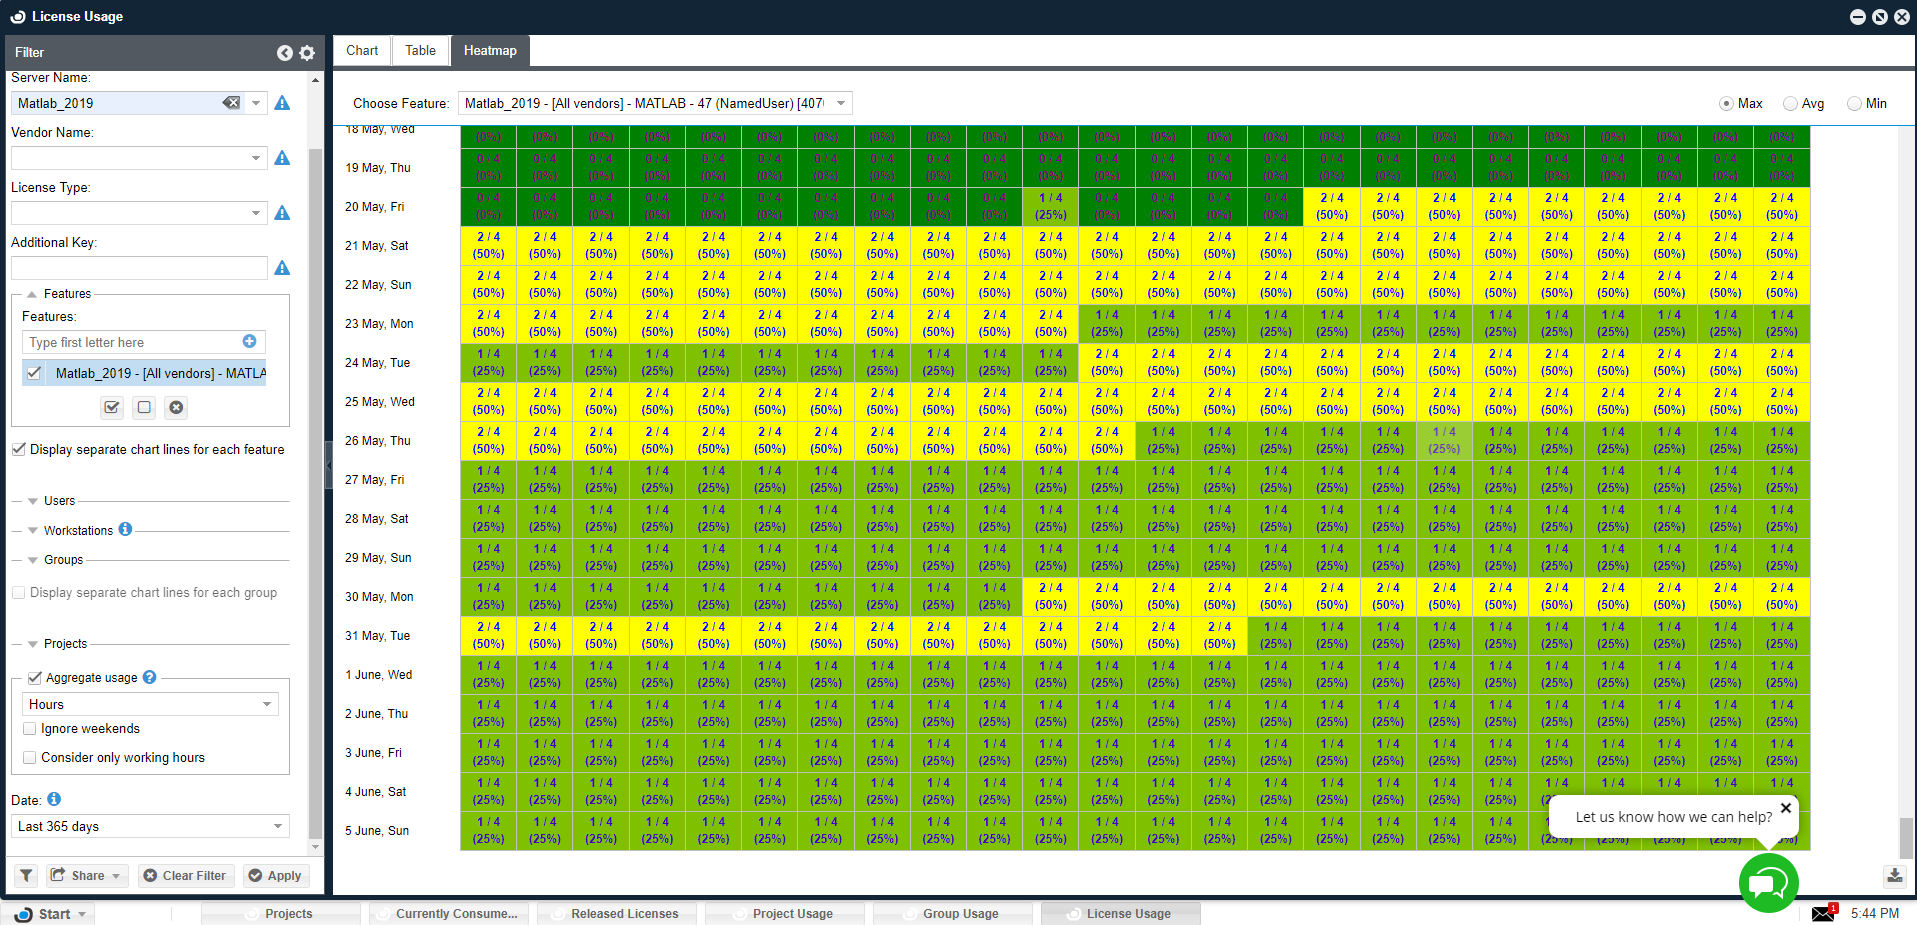
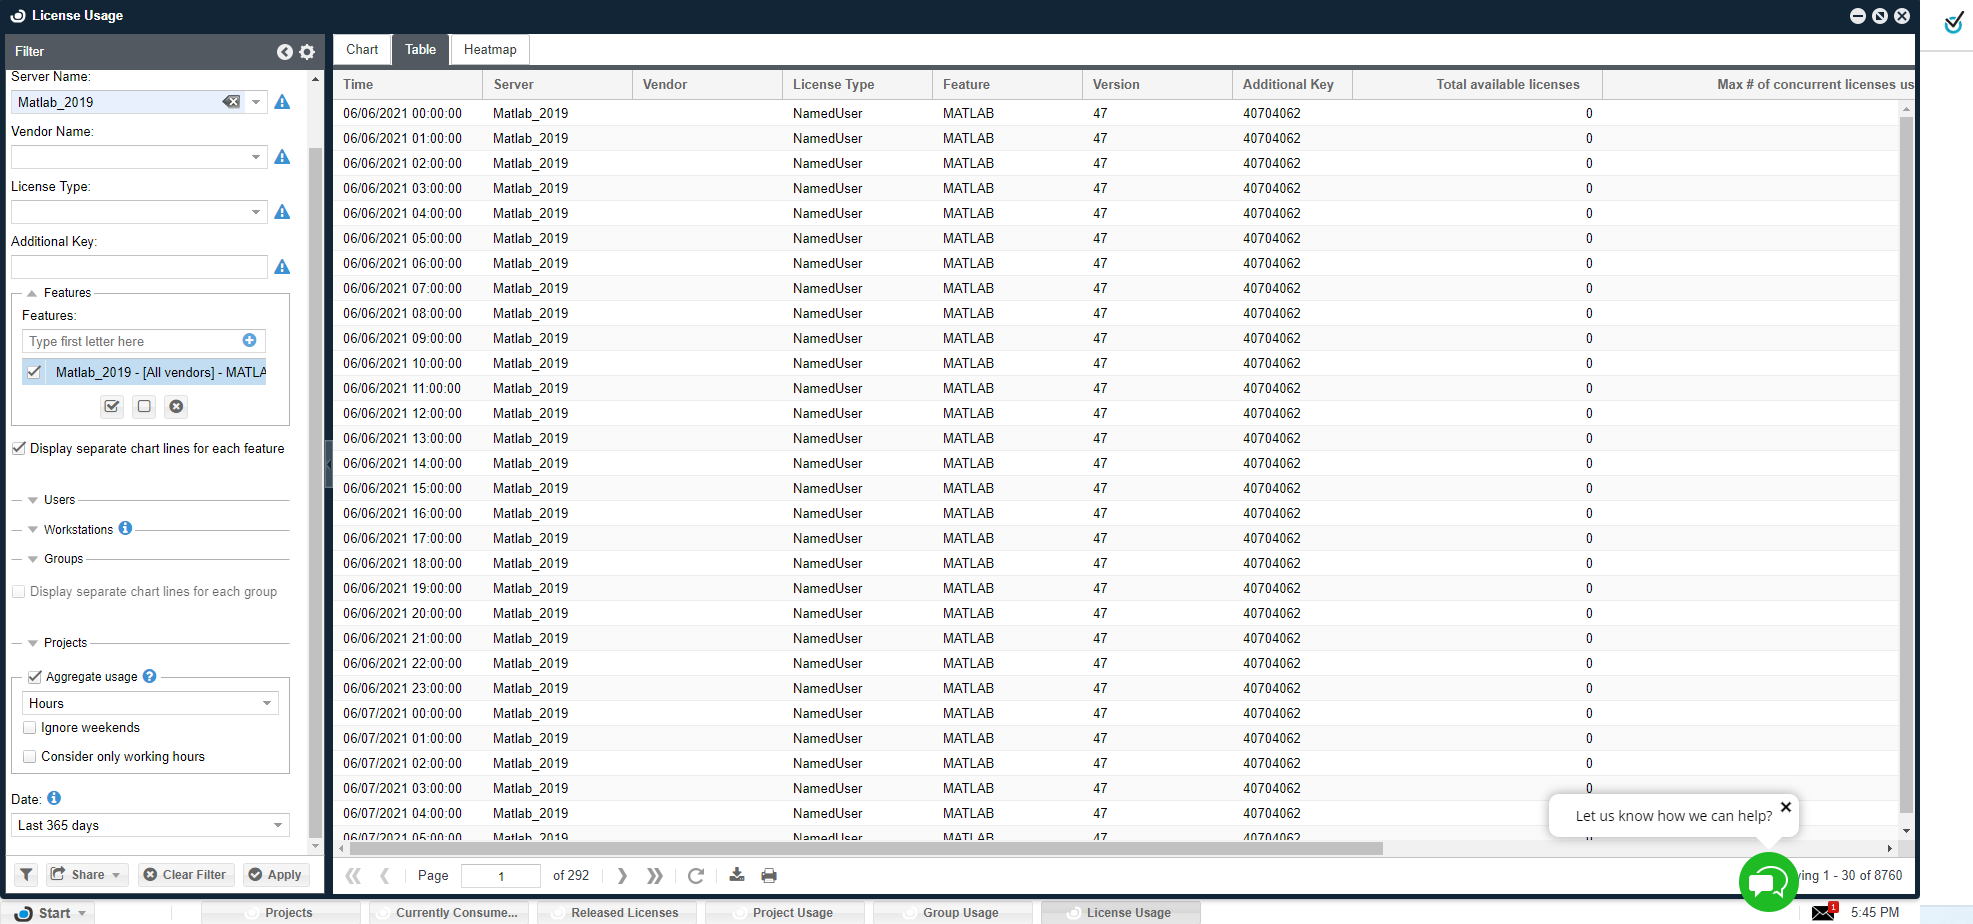
Some of the "License usage" window filter functionality is unique:
- The time span of the usage report is configurable: select between predefined periods (for example, last 30 days) and a start - to - end period definition
- When displaying a chart view, the displayed period can also be zoomed - in using the zoom drag buttons, at the bottom of the chart.
- The "Aggregated usage" check box selects between displaying the maximal level of usage sampled per period (hour /day / week) or the actual usage occurrences as reported by the license manager.
License activity
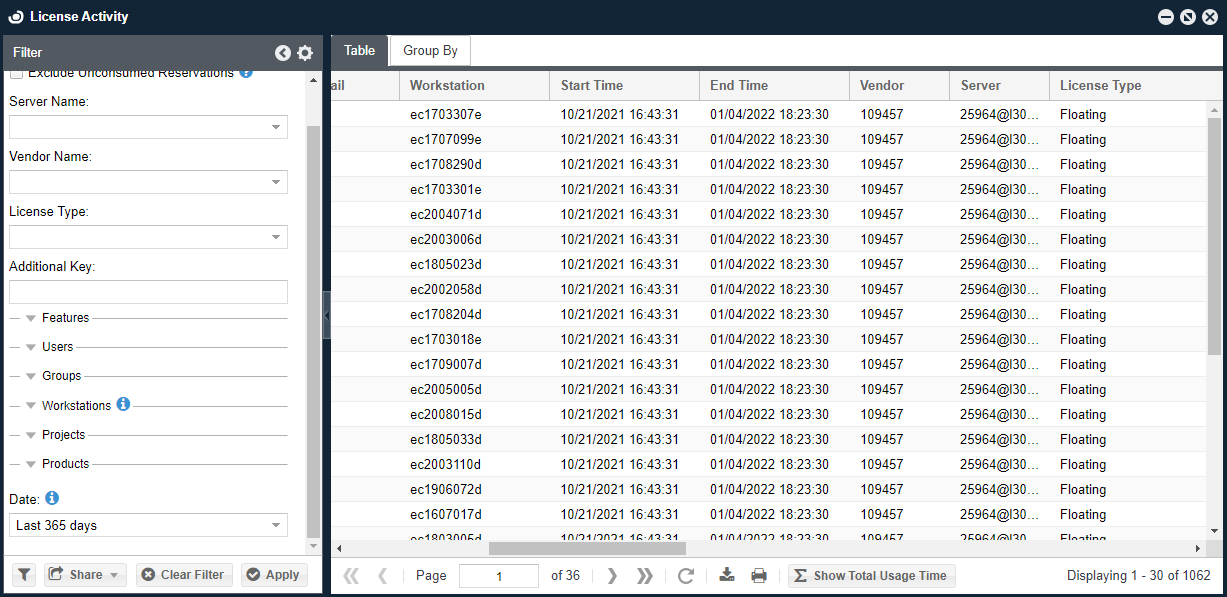
The License Activity window presents an account of all application sessions that have consumed a monitored license.
By default, this window presents only ended sessions (that is, those that have a start and end time), but it can also be configured to present currently active sessions.
The license activity window is a very powerful tool that allows system administrators and license administrators to produce elaborate reports and track license activity of individual users.
The "Group by" tab on this window facilitates license statistics report generation according to Server, Vendor, Workstations, Features, Users, Groups, and Projects.
License allocation
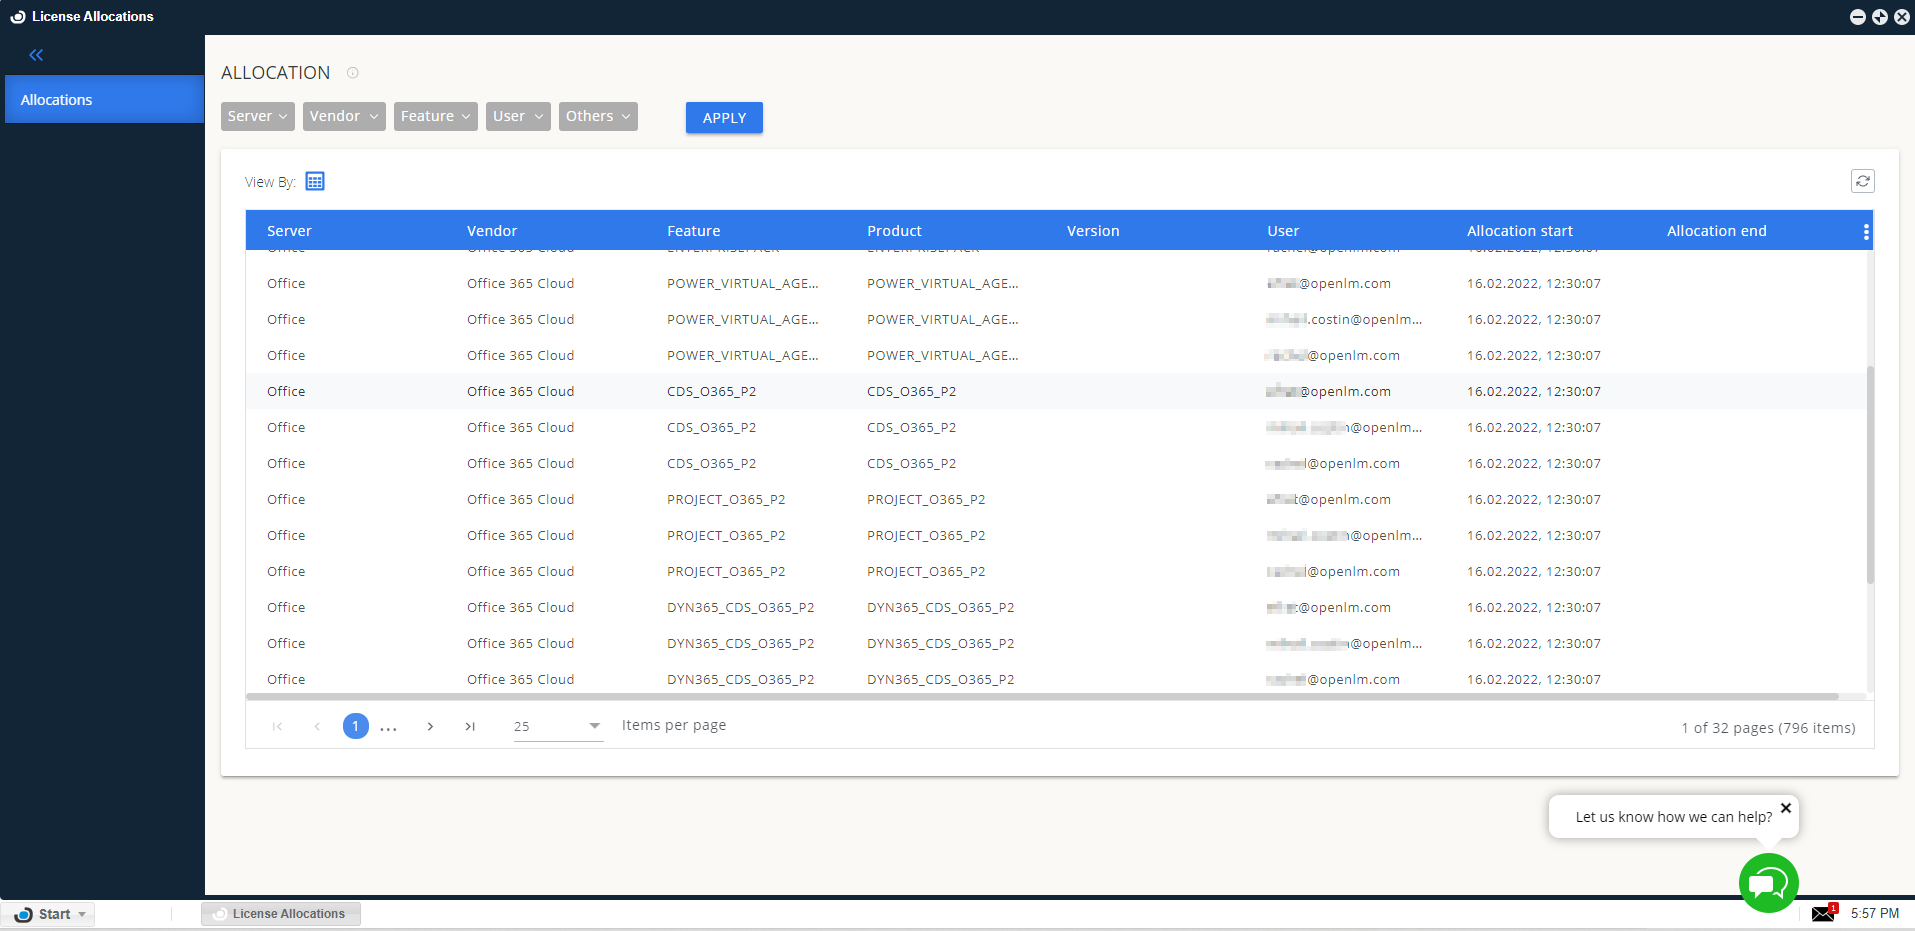
The License Allocation screen allows to find out licenses which are allocated to whom. Also, it gives the possibility to check the usage statistics.
Filters: Use filters to select necessary allocation options and users to get the precise report. Select the filter parameters and select "Apply" to proceed to the result.
Table: The report results are displayed in the table view.
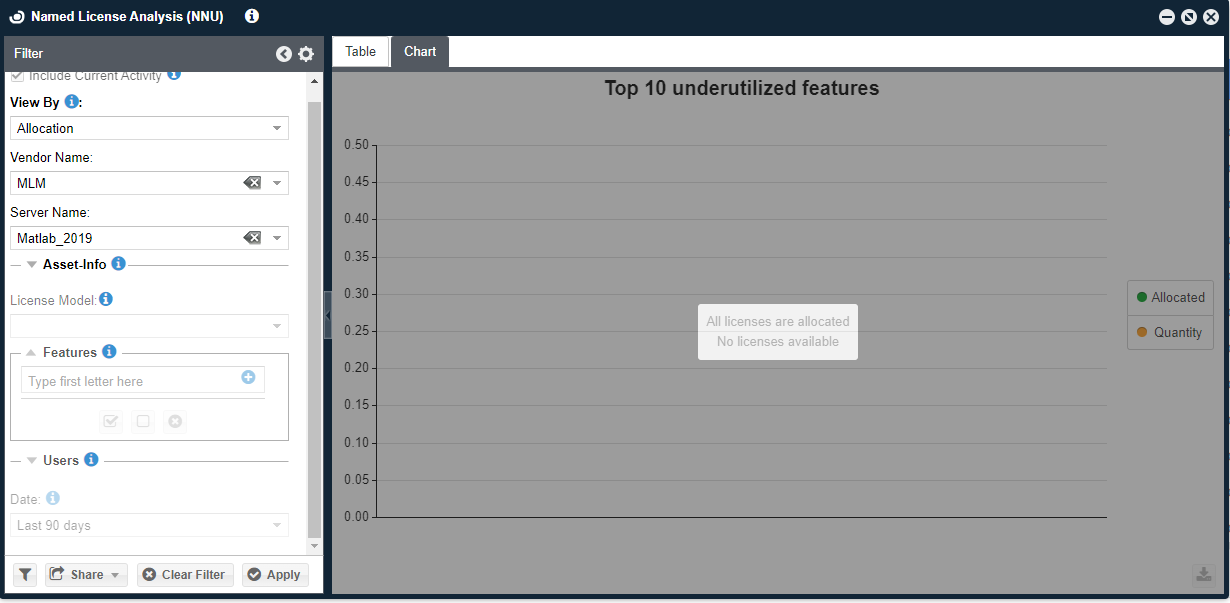
Named license analysis (NNU)
The Named License Analysis (NNU) report provides an overview of the license allocation and consumption of your FLEXlm named licenses.
This report has several benefits for administrators as it allows to determine the real usage of an organization's named licenses, which can help with license planning and reducing costs. After running the report and analyzing the results, the administrator can decide whether to assign more users to NNU licenses, reduce the load of floating licenses or purchase additional licenses.
For more information on this report, consult the specific item.
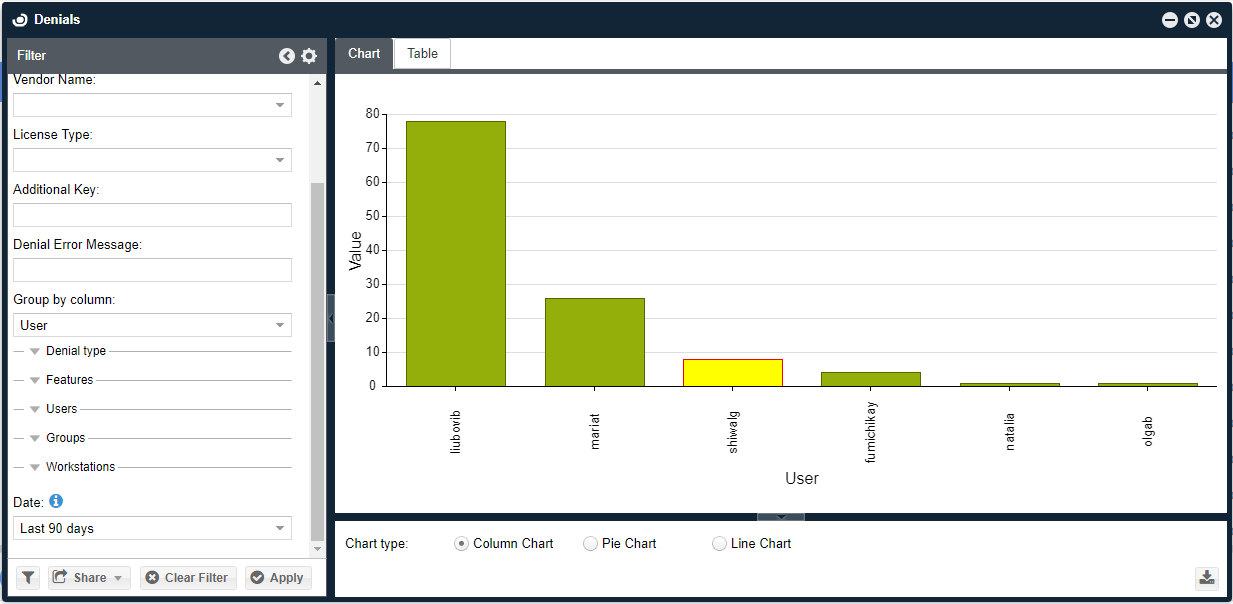
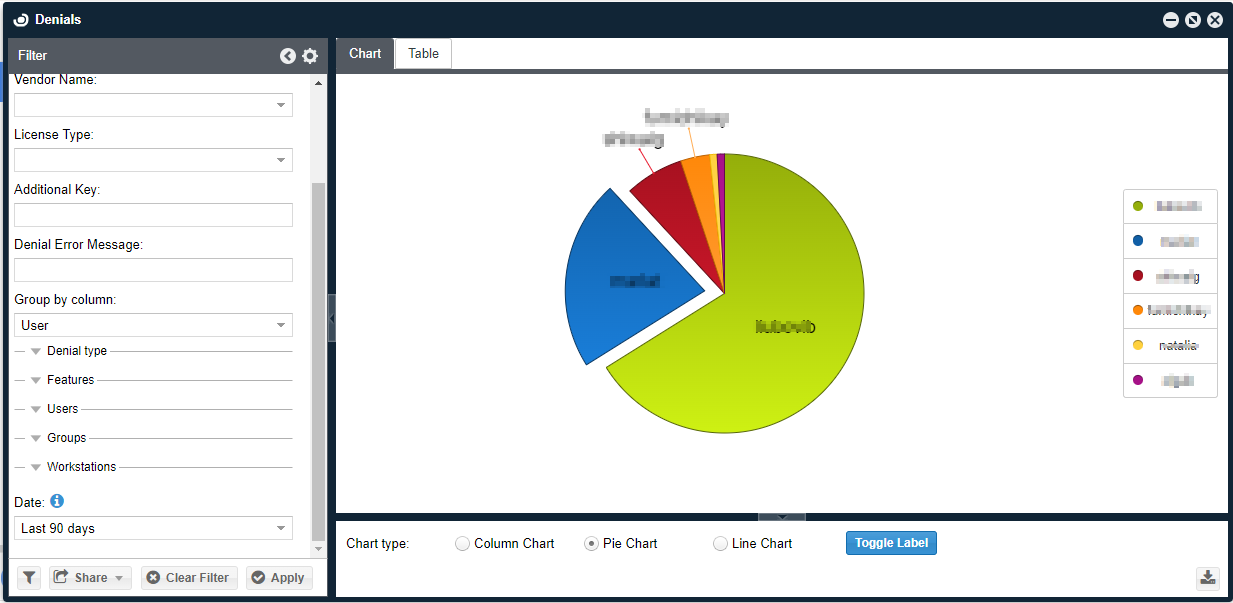
Denials
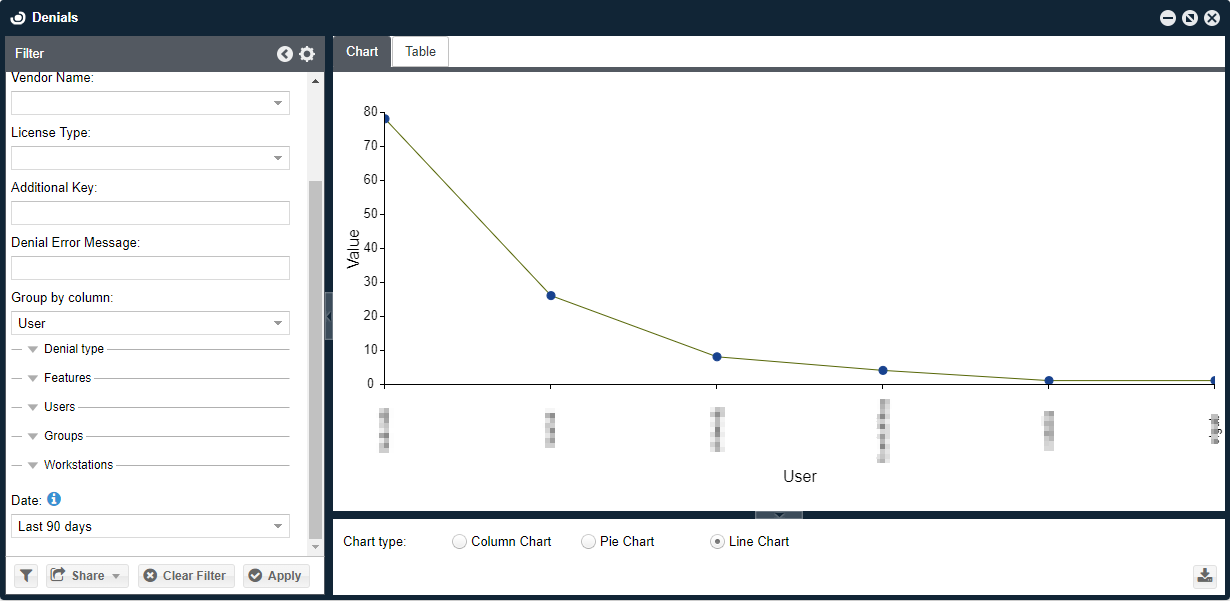
This is a presentation of historic license denial occurrences. It is available only for license servers that implement license denials, for example, FlexLM, DSLS, IBM-LUM and others. Requires the employment of an OpenLM Broker on the license server machine. Consult this document for more information. A few points to note regarding the Denials report window:
- Information may be sliced according to a list of criteria, for example, time, user, project, group, workstation, denial type, vendor name, license server, license type (for example, Floating, Node-locked), and "additional key" (for example, FlexLM asset info).
- It may be presented as a pie chart, line or table.
- The filter includes a "True denials" check box. This option filters out irrelevant denial reports made by the license manager. Such irrelevant reports include:
- Multiple requests made by a specific user in a short period of time, and
- License requests that have been denied by one server, but granted by another.
Feature usage per group
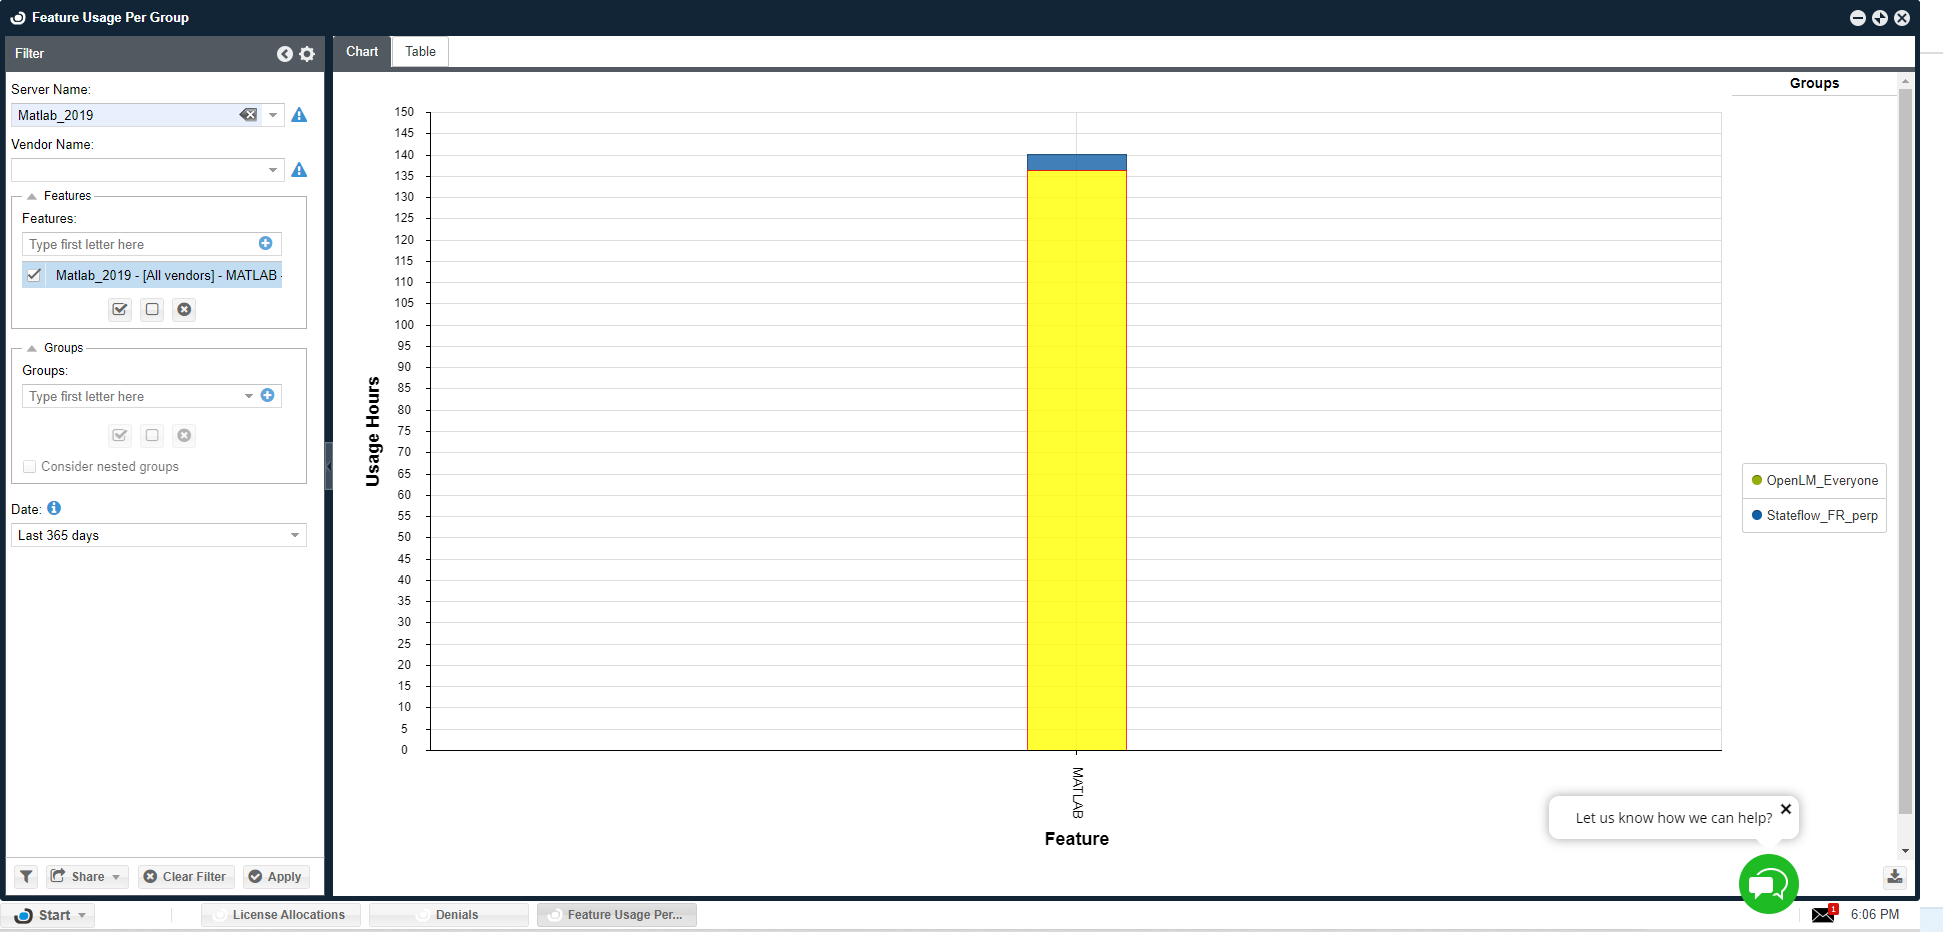
This window presents the usage in hours of selected features per the selected user groups or all active groups, in a stacked vertical bar chart. Hover over the chart to view explicit usage information per each section of the bars.
Feature usage per user
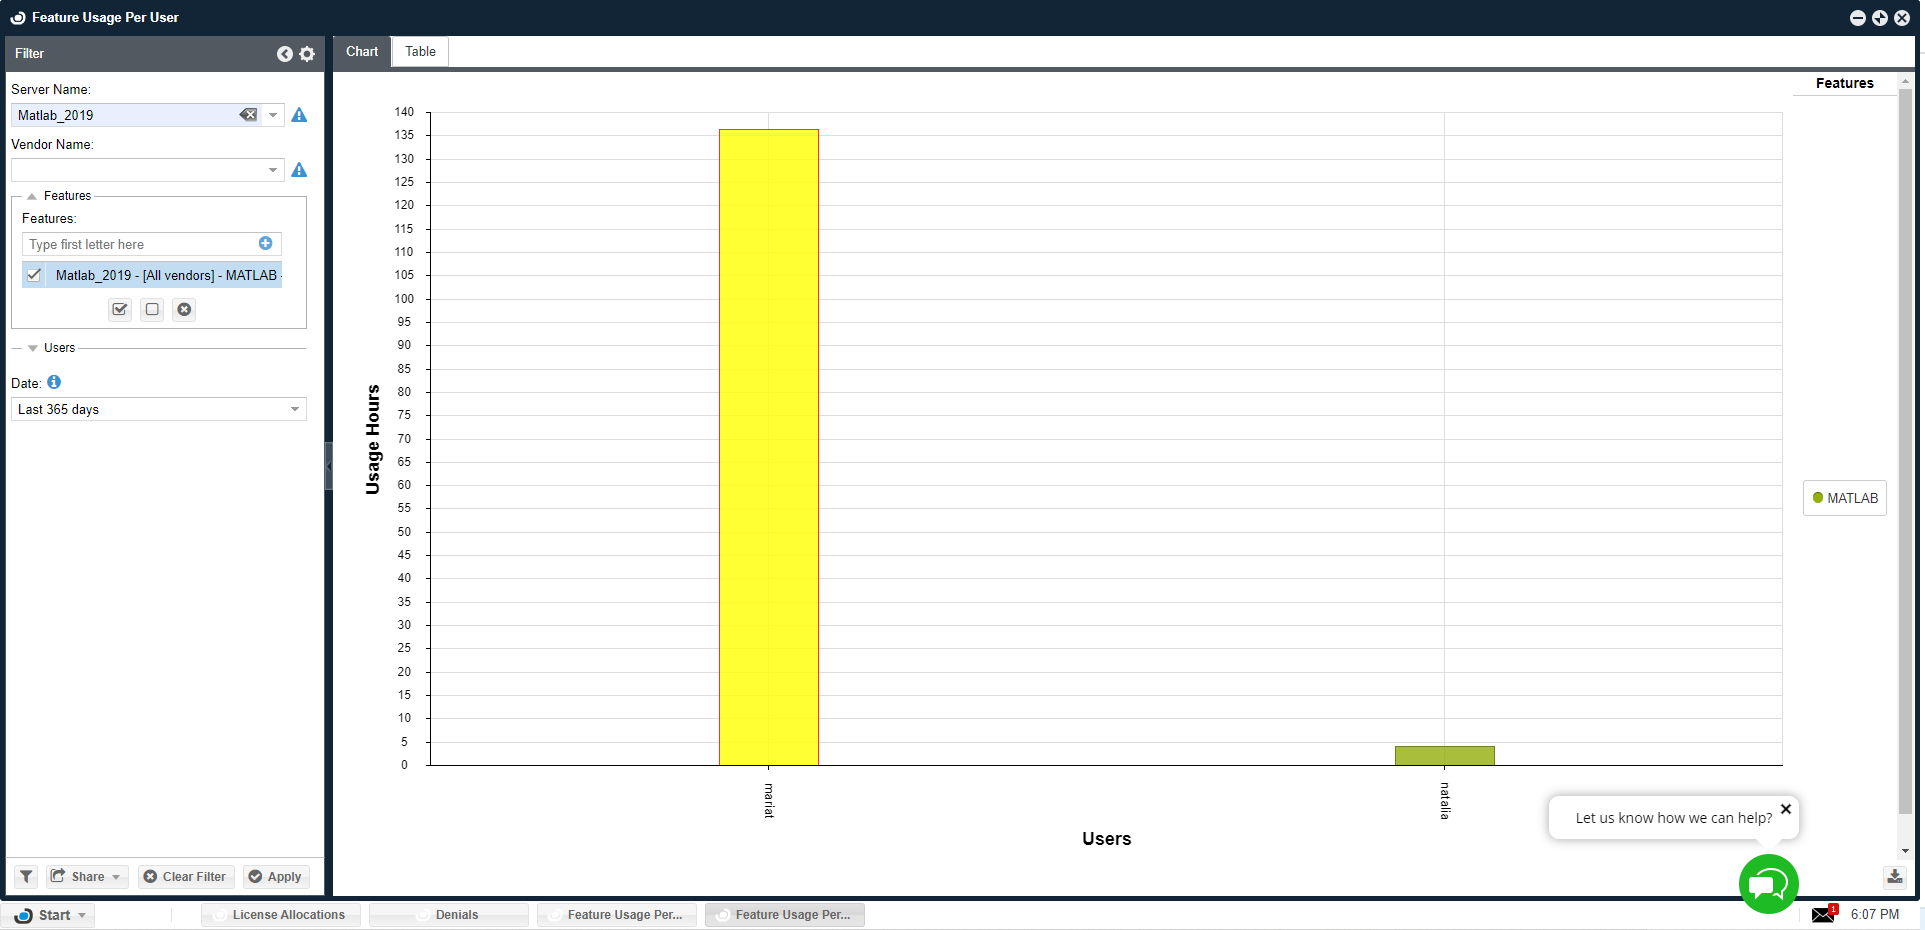
This window presents the usage in hours of selected features per the selected users or per all active users, in a stacked vertical bar chart. Hover over the chart to view explicit usage information per each section of the bars.
TokenFlex
Token Flex is a cloud-based, pay-as-you-go licensing model from Autodesk where the customer buys several tokens (referred to as a "token pool") and pays with these tokens each time a user runs a product belonging to a certain product family within a specified amount of time (usually counted as 24-hour intervals).
This window presents 3 reports on TekenFlex:
- TokenFlex Usage
This report shows the total number of tokens that were consumed for a certain product family along with the total consumption time. Two types of views are available: table and chart. Keep in mind that due to the way vendors calculate token consumption, the reports are displayed with a 48 hour delay. In addition to this, the Token Usage report can group the data by User, allowing you to see how many tokens a certain user has consumed.
- Double Token Consumption
This report shows suspected cases where a user might have been charged twice for the same product family during a working day. - Released Idle Licenses
This report shows suspected cases where a user might have been charged twice for the same product family during a working day.
EasyAdmin user interface - administration
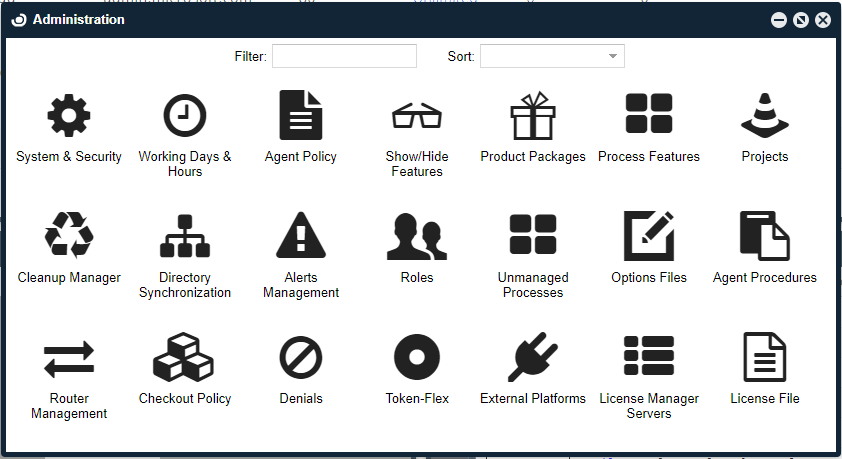
The configuration screens allow users to set their preferences. The choice of working hours affects the statistical information which is calculated and shown to all system users.
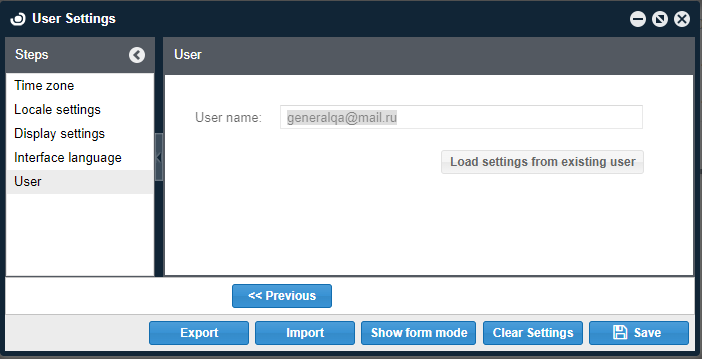
User settings
The configured preferences in the "User" window effect the format of information as it is presented to the User.
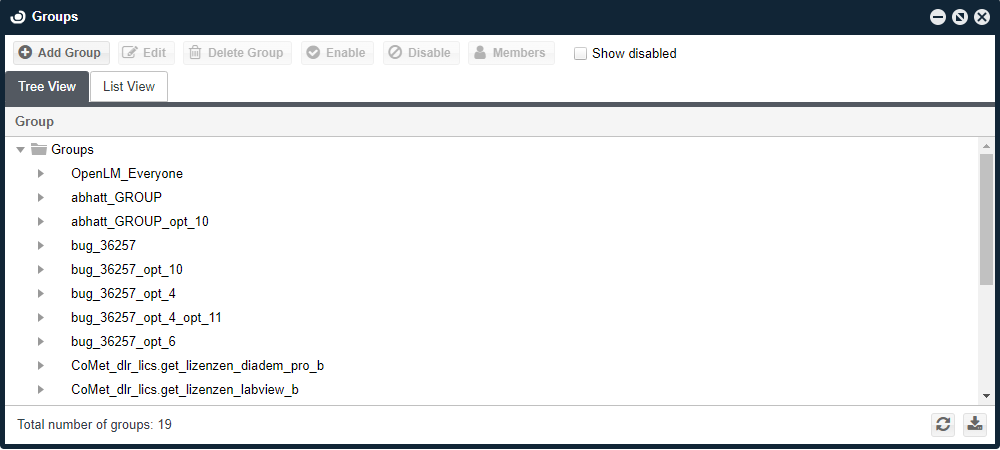
Groups windows
Users and permissions - workstations window
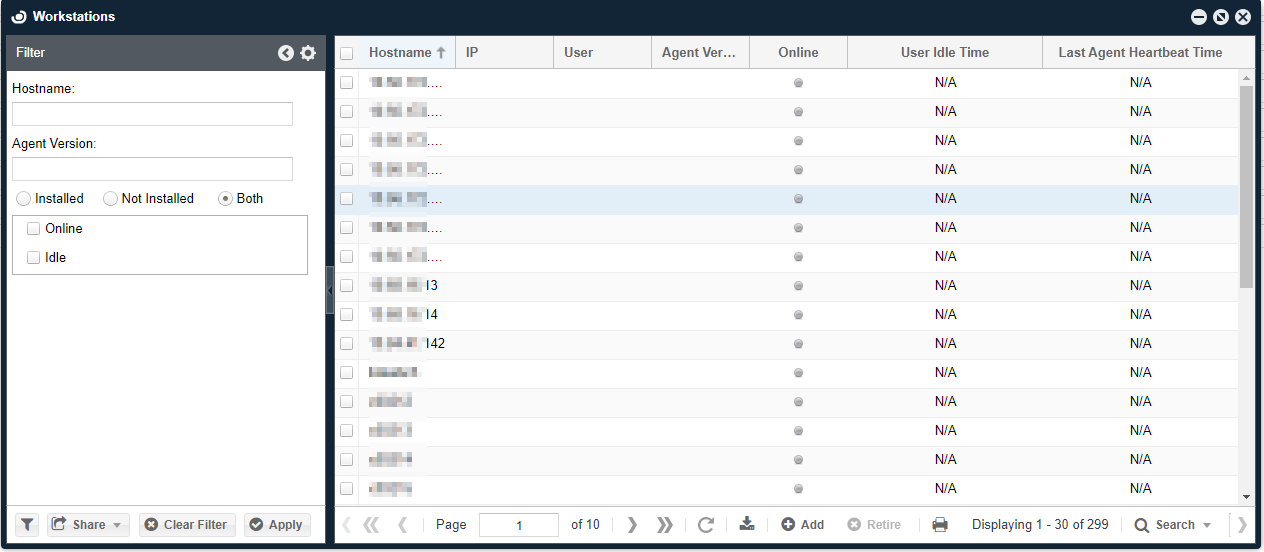
The Workstations window provides all the information a system administrator needs to manage workstations that are accessing licenses.
This information includes:
- Hostname
- Agent version (if applicable)
- Online (Workstation is online or offline)
- Idle time (User idle time)
- Controlled (for supported systems)