Most organizations rely on expensive engineering software applications in their daily workflow. As with every company asset, the proper management of these high-value, software application licenses requires integration with an asset-management tool; otherwise, companies risk losing control of their finances. Unexpected licensing costs may accrue due to excessive license usage, or underused software applications further increase company expenses.
Detailed information and data on these high-value engineering applications is essential for every company, as it offers management visibility, transparency, awareness, clarity, and forecasting power. The more mature the level of a company’s IT asset management, the greater the benefits. As IT organizations progress from level to level up the maturity curve, each step will yield incremental savings, resulting in lower costs, decreased risk, and increased business alignment, as market research company Gartner points out in a report on IT Asset Management Maturity.

Companies working with high-value engineering applications are investing in software asset management (SAM) for several reasons:
- to gain financial control;
- to ensure compliance, which means they are fully licensed and compliant at any given time an auditor pops in;
- to optimize resources;
- to efficiently manage human resources;
- to attain a stronger negotiating position with the software vendor when renewing software license contracts.
To achieve these goals, companies need tools that support an effective software asset-management program, and this is why we at OpenLM work hard to provide the right tools, such as the Reporting Hub, to our customers.
The OpenLM service increases visibility levels for the management and administration of software licenses across the company, and achieves higher levels of operational productivity, because it gives users the most accurate and clean data to analyze. With exact data on usage data at hand, decision-makers are in the driving seat when negotiating better prices and better deals for the company with the software vendor.
So what is the OpenLM Reporting Hub?
The Reporting Hub is a powerful extension of the OpenLM service. It is the non-plus ultra of data, because it represents a visual gateway into every data point OpenLM measures. In other words, it is the most comprehensive, customizable, and easy-to-understand visualization of everything that happened with the software assets a company holds within a defined period of time. If you want the data to work for you, then this is the tool you need. Here is what the Reporting Hub extension offers OpenLM users.
Visibility through interactive, custom charts and graphs
Coupled with a powerful business intelligence (BI) tool – for example Power BI from Microsoft, although it works with any BI tool – the OpenLM Reporting Hub extension gives users access to a customizable visual report. With just a few clicks you have all the data you need, structured with the measures-dimensions structure in mind, the current industry standard for BI-friendly databases, where dimensions range from calendars to workstations, and measures from raw usage duration to unused tables.

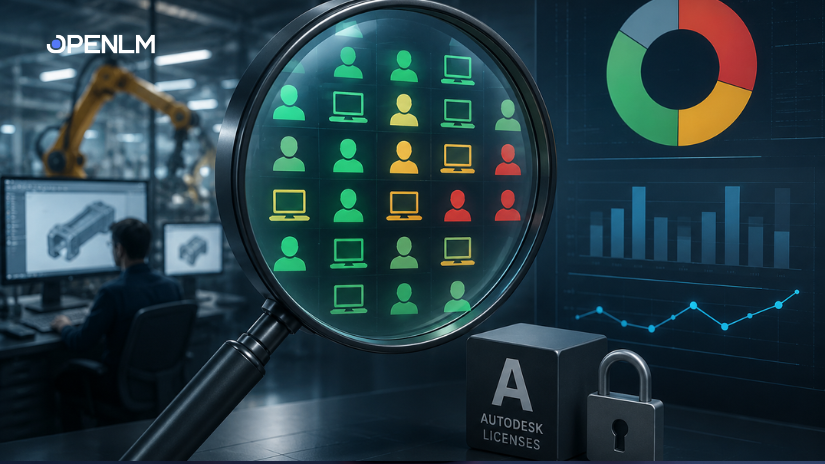
For example, with just a few clicks, OpenLM Reporting Hub users can immediately spot license hogs or employees with too much idle time. When working with raw data, it requires too many working hours just to assemble the final report that highlights the issue. As a Reporting Hub user, the power of business intelligence gives users the option of layering the different dimensions together. Simply put, you get aggregated, ready-to-use data in just a few minutes that builds on the OpenLM database, without the hassle of manually filtering through the raw data.
A complete list of applicable measures and dimensions is available from OpenLM’s knowledge base. It’s basically an endless drill-down into all the available data using simple drag and drop.

Transparency in license usage through custom filters
When it comes to data transparency, the Reporting Hub extension goes the extra mile: using Power BI allows endless customization of reports, with accurate and automatically updated data points of the custom query. It is your data, and you therefore have the right to have a clear view of what is happening within the company, which helps raise the awareness of decision-makers when identifying tasks, workflows, and other areas where applications could be used more efficiently.
OpenLM Reporting Hub options
OpenLM provides three options to make data work for you using the power of the Reporting Hub:
- Simply receive the end report – in case you don’t want to deal with data manipulation, don’t have time for it, or you want just a report. OpenLM will allow you to schedule a report on a daily basis; a sample report such as, for example, license utilization.
- Manage your own reports using your custom specifications on-premises.
- Manage custom reports in the cloud.
The latter two options require professional services (OpenLM support), but the final result is the custom report you need. It connects directly to the hosted reporting database on the OpenLM systems, which eliminates the hassle of any type of maintenance. It is a direct link to the reporting database and, when connected to a BI tool, will give you a customized, visual, easy-to-understand report based on real data. This database provides aggregated, calculated data points ready for you to query.
What SAM can do with the OpenLM Reporting Hub data
As you can see, the OpenLM Reporting Hub is a powerful tool for leveling up the IT asset-management maturity of the organization: it gives you a more finely tuned exploration of the data on license usage, always displaying accurate and fresh information in an easy-to-understand format. Out of the box, the company is able to analyze global trends and drill down into the details by department and user level to evaluate and prepare new vendor agreements. Within just a few weeks of reviewing the newly acquired data, the company is able to detect previously unknown underutilized software and usage patterns.
So how do we do that? Well, to deliver that data, the OpenLM Reporting Hub uses a data engine (ETL) that crawls the reporting database OpenLM oversees, and then presents it using the Power BI’s easy-to-use interface.
We at OpenLM strive to deliver all the data you need so SAM managers can make informed decisions and design effective processes to achieve company-specific goals and objectives, while taking into account corporate policies, standards, and procedures modeled according to proven industry best practices. The Reporting Hub is in essence a tool that gives decision-makers control over the company’s software assets, with consistency and accuracy in mind. It puts decision-makers in the driving seat.
For more information about OpenLM’s Reporting Hub, head to our website, download the OpenLM software, and test it for yourself. Or get in touch with one of our sales team to get a customized version of the OpenLM service.